A Week in the Market: An Overview
As we delve into the intricate world of the market this week, we find ourselves navigating through various trends and indices.
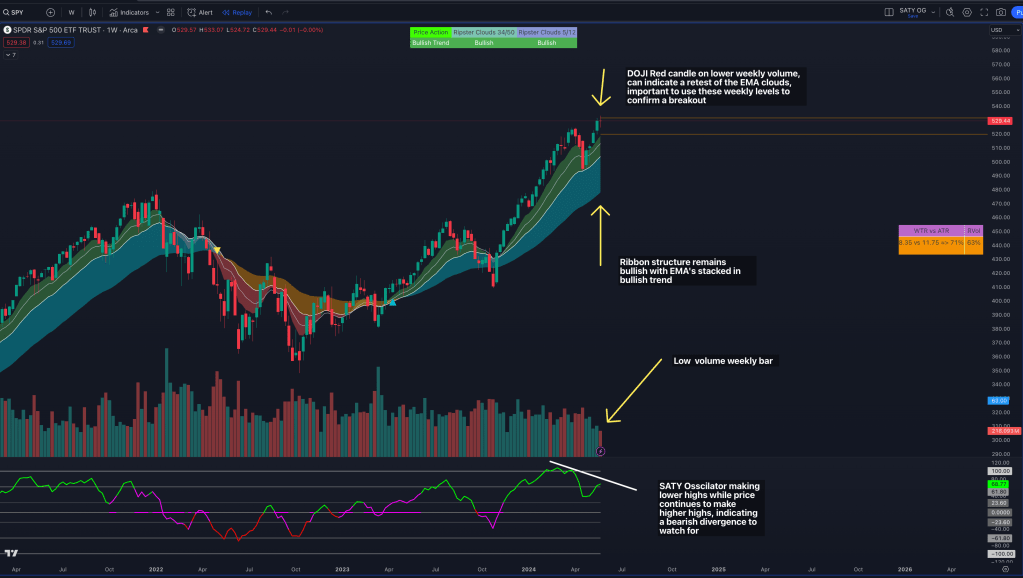
Weekly Trend
The week remains bullish, with SPY far above the 5/12 EMA Clouds and the 34/50 Clouds remaining bullish. A high of 533 and a low of 524 have been observed. The candle structure indicates a potential pullback to the weekly 5/12EMA Clouds, presenting a dip buying opportunity around 518.
The oscillator shows a bearish divergence with SPY making new highs in price but the oscillator making lower highs thus far. This divergence may suggest a pull back to the weekly 8EMA around 518.
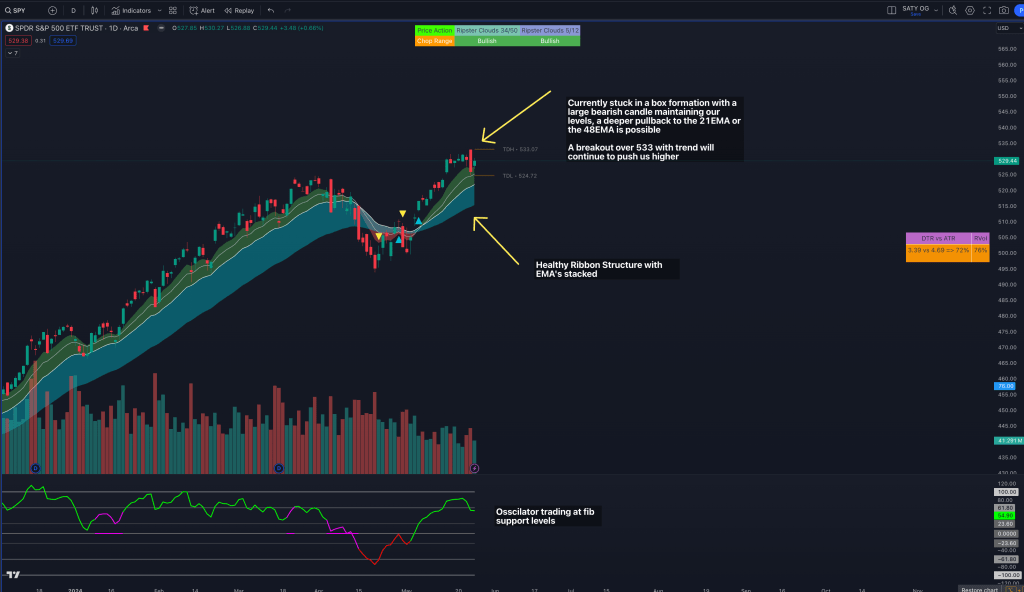
Daily Trend
On a daily timeframe, ribbon structure is still bullish with clouds maintaining healthy bullish structure with EMA’s stacked. A large inside bar formation was observed following massive selling pressure coming into NVDA earnings. 531 and 525 are key levels to break out of. Although the ATH resistance still exists, it should be longed with trend. The previous box breakout zone of 523 may be retested, which will coincide with the 13 EMA. The oscillator appears healthy with a slight pullback into fib supports.
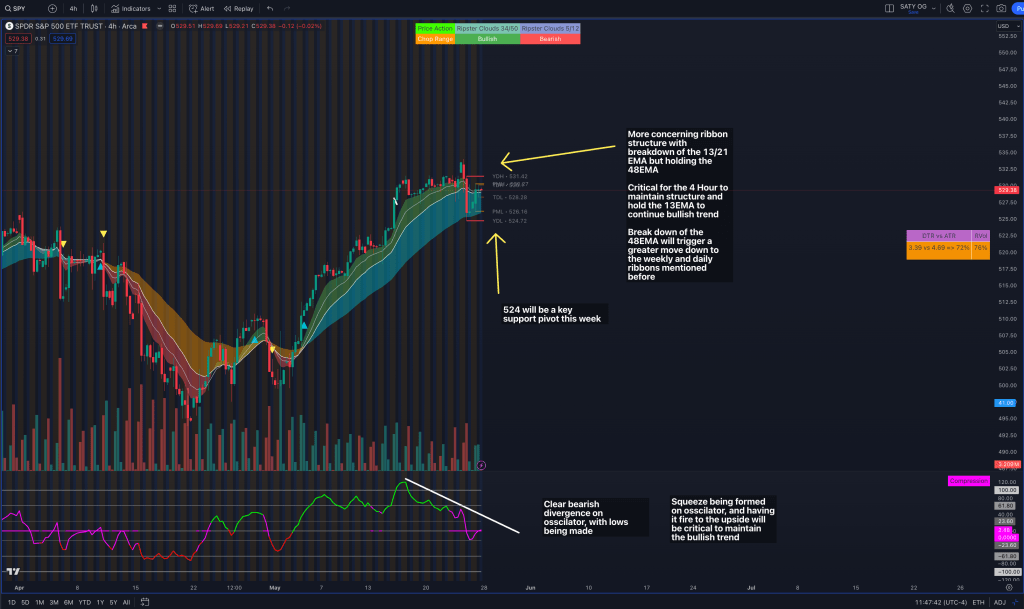
4-Hour Trend
The 4-Hour trend is our first sign of compromising the bullish structure and will be the time frame to watch for signs of a deeper pullback to the Daily and Weekly EMA’s. Price is held up in a box with the oscillator moving lower and forming a squeeze. The key price to hold on the 4-Hour trend will be 524 and the 48EMA as our last lines of support. The squeeze firing down should trigger the pullback.
1-Hour Trend
On the hourly scale, the trend is currently lost and is redefining itself with the ribbons being crossed. It currently indicates bearish chop, but the reality is that we are in a box. Confidence for longs will be built with the restructuring of the 1hr ribbon with the 5/12 and the 34/50 EMA turning back bullish.

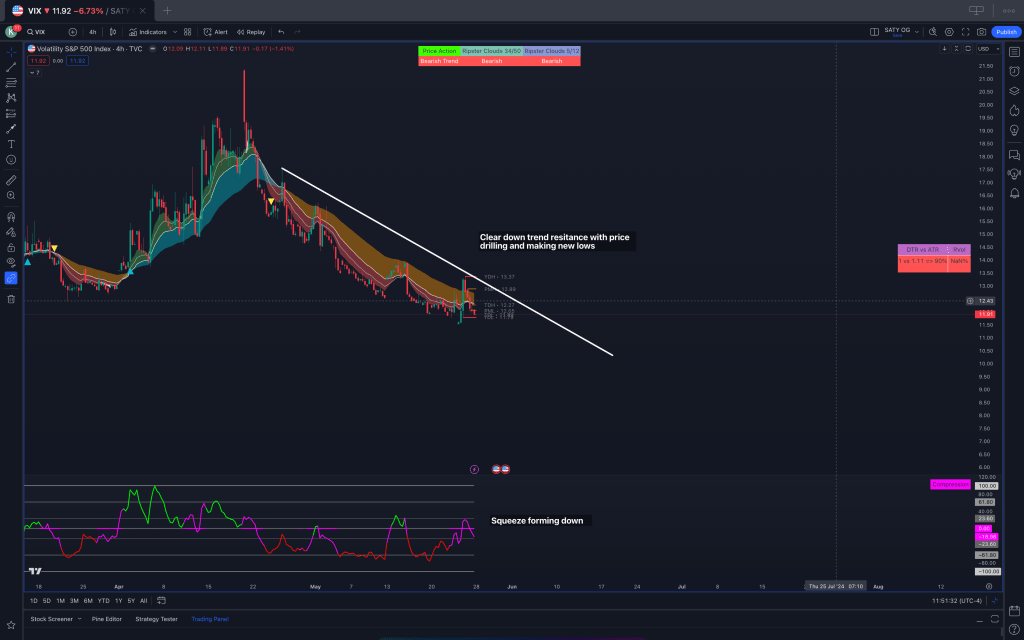
VIX Time Frames
On the VIX time frames, a weekly bearish structure remains with a squeeze pointing down, has room down to 10 PYCH level. The daily trend is lower, and the 4HR is respecting the downtrend line with a squeeze pointing down.
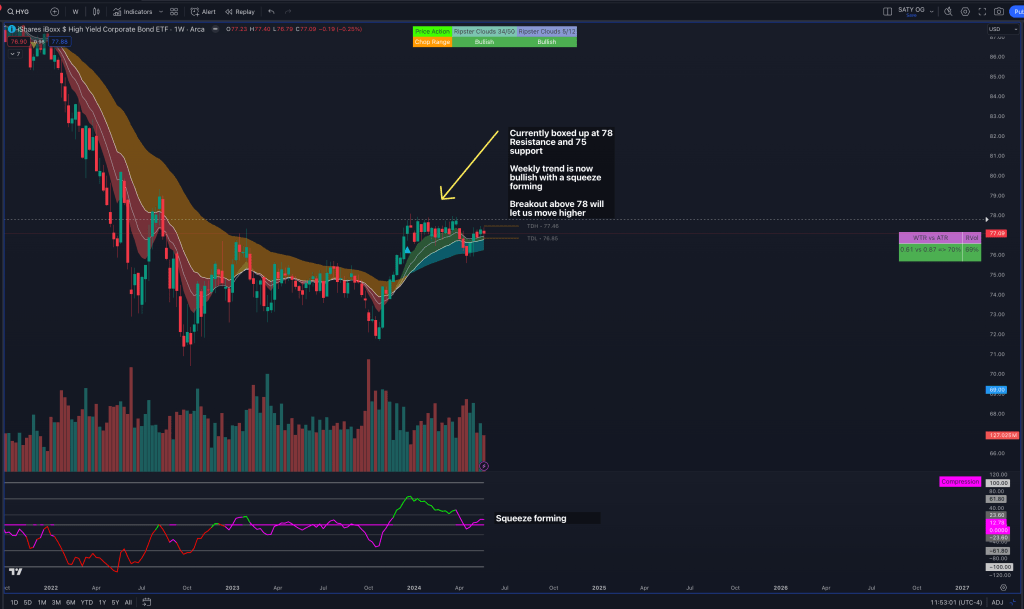
Junk Bonds (HYG)
In the world of junk bonds, the weekly timeframe is holding a bullish structure with a squeeze pointing up. Investors are clearly showing an appetite for risk in this environment by maintaining a bullish structure on junk bonds.
In summary, this week’s market trends and movements have been a blend of bullish structures and bearish divergences. The market continues to evolve, providing opportunities for both long and short strategies. As we continue to observe and analyze these trends, we remain hopeful for a prosperous market.

Leave a reply to Market Outlook 06/03-07 + Last Week Recap – MDTrader: HEALING YOUR TRADING JOURNEY Cancel reply