TRADING TOOLS
SATY ATR Levels
The ATR Levels are a pivotal aspect of the system as they provide our support and resistance levels for intraday trades and give us an understanding of a particular stocks range. The ATR levels provide us with daily ranges, weekly ranges, and monthly ranges which allow us to understand how far a stock can move in the given period. Using these levels allows us to stay grounded in our approach by setting reasonable price targets, while also understanding at which prices will react.
SATY Pivot Ribbon
The SATY Pivot Ribbon is an EMA cloud system that provides a visualizing of the current trend in the market. In the MD Trader System, we give emphasis to the 3, 10, and 1H trends on an intraday basis. On a week-to-week basis we give emphasis to the 1H, 4H and Daily EMA clouds to help guide and understand the trend for the ticker.
TTM Squeeze Pro
The TTM Squeeze Pro is a tool used for intraday analysis to identify consolidation and the potential release of the accumulation in consolidation for a move to the upside or the downside. The Squeeze is a powerful tool in helping indicate when may be in an accumulation mode and then allows to understand when it will transition to a distribution mode.
Premarket Highs and Lows
Premarket Highs and Lows provide the basis for identifying stocks that will be either in trend or in chop. When a ticker is trading within the premarket range without breaking out, it is often an indication that we will remain within that range of price action. Premarket Highs and Lows often act as places of price reversals and can be used as a resistance/support level.
Yesterday Highs and Lows
Yesterday Highs and Lows played a similar role in the system as the Premarket Highs and Lows and can indicate whether the ticker will remain in range or a have a trending day. These levels can also act as key support and resistance levels which can be traded with.
SYSTEM SET UPS
The MD trader system long set up is based upon the levels determined in premarket planning alongside the EMA clouds. Levels are used as points of support or resistance.
Support in a bullish environment is seen as a place where price will hold and consolidate before making a move to the next level which is a resistance. In the bullish environment the resistance is a place where price may stall and consolidate, before moving above that resistance and turning it into a place of support.
In a bearish environment resistance is seen as a place where price is unable to cross upwards and acts as a wall to the next level which is a support. In the bearish environment the support is a place where price may stall and consolidate, before moving below the support and turning it into a resistance.
The EMA cloud in our system set up plays two roles, it tells us the objective trend of the intraday market using the 10-minute EMA clouds and acts as a dynamic spot of support and resistance. The SATY EMA clouds utilize the 8, 13, 21, 34 and 48EMA’s. Intraday when taking trades, the most important EMA’s are the 8 & 13. The 13EMA is our key pivot that tells us if the bearish or bullish environment is still intact, once that EMA has broken down, it is time to make our bias neutral, or prepare to take the opposite bias.
Understanding Risk
It is inappropriate to talk about entering a position without talking about our risk, or in more lay terms, when we accept that the thesis for the trade is now invalid
When entering on the break and the retest of a level, the level acts as our key risk point, a close below the level in which we entered, the trade has now become invalid and should be reversed.
When entering a trade using the EMA clouds, which is typically the 8EMA or the 13EMA, the 13EMA is our ultimate risk point. A close below the 13EMA and we cut our position.
To mitigate risk as best as we can, it’s important that we take our entries as close to our risk points as we can, this will be illustrated in further examples.
SYSTEM LONG SET UPS
The system long set up is based upon the levels and the ribbon. In the system long set up, we are looking to take a long position at an identified level of support or in an up-trending ribbon that is consolidating above below/above support.
Conditions
- Break above identified level (Mandatory)
- Trending 10-minute ribbon (Mandatory)
- TTM Squeeze (Optional but ideal)
Entry
- On a pull back to the support level, either the identified level in premarket planning, or the 10M EMA cloud
Risk
- Close below support level if far from ribbon
- Close below 13EMA 10Minute ribbon if level and ribbon close
Take Profit
- At next resistance level, ATR or identified in Pre-Market
- Close below 13EMA if riding the trend
JULY 3RD $ARM LONG WITH LEVEL
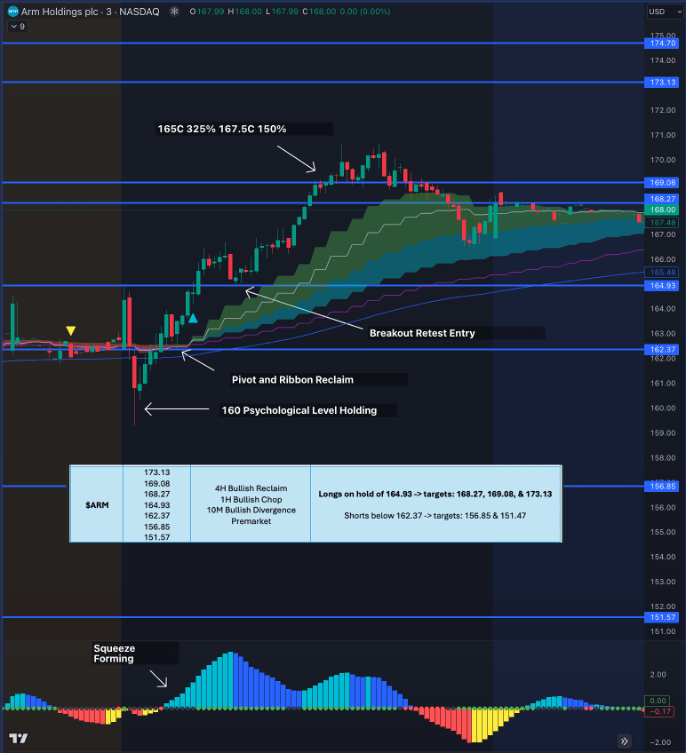
Ticker Context 4H EMA trend was bullish, 1H EMA trend was bullish and the 10M trend coming into the open of the market was in a bullish transition. The plan on $ARM was to long it on a hold above 164.83 to target 168.27.
- As price was coming into open, TTM squeeze showed a squeeze forming, that was modestly pointed towards the downside
- After the opening candle was immediately rejected our long pivot
- Since the 10M ema cloud was not yet properly stacked to the downside there was no entry for the short position.
- We immediately recovered the 48EMA on the 10M which is a key bias pivot in the system, indicating bullish momentum
- The first pivot, 162.37 was immediately recovered alongside the 10M ema clouds
- Price began to recover our long pivot while firing the 3m squeeze the upside and the 10m EMA clouds were now fully stacked
- Our entries are based upon taking entries on a level break above and then entering as close to the level as we can as that is our risk
- Once price retested the 164.93 level, it was appropriate to take a position to target the next level above, which now was a resistance level.
- Had price closed below 164.93 the trader now has two options: to either add more position at the EMA clouds, or to cut the trade all together and reassess later in the day, this is dependent on risk tolerance and sizing of the trade.
$META JULY 3RD LONG WITH RIBBON
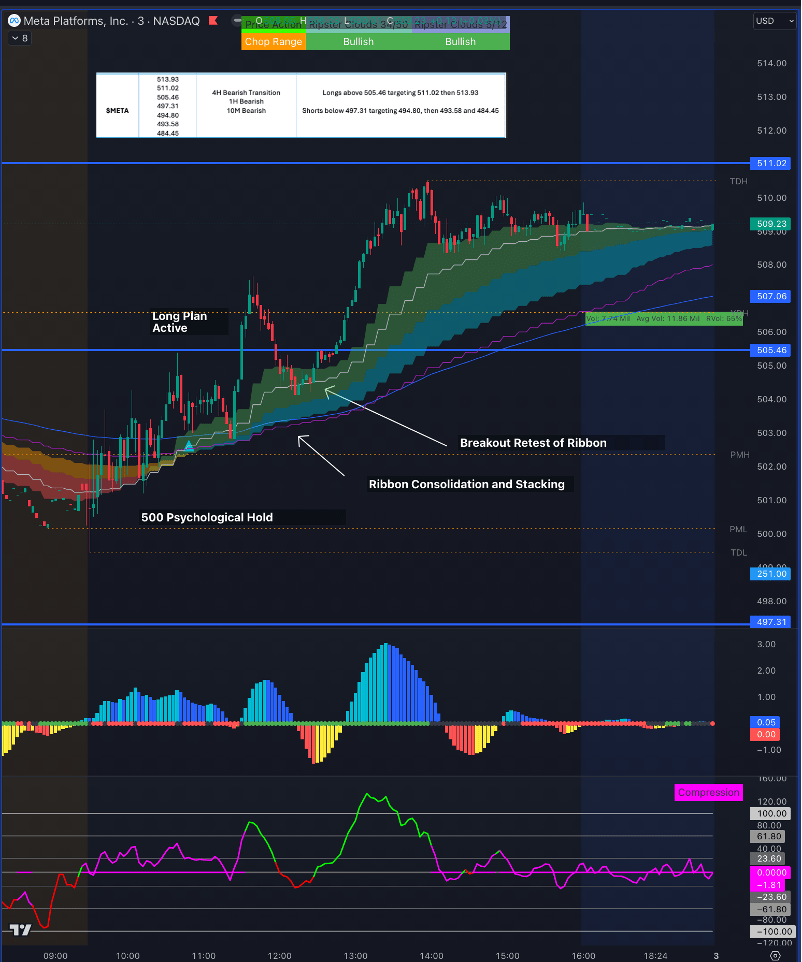
Ticker Context: $META had bearish 4H, 1H, and 10M trends coming into the market. The plan for $META was to long it above 505.48 to target 511.
- $META was bearish coming into the market and had a 3minute squeeze forming pointing to the upside
- $META’s 10M EMA cloud started to begin stacking towards a bullish transition under the level.
- $META had a sharp move up ultimately taking the level out and expanding far beyond it.
- The novice trader may experience FOMO and take a poor entry here, however, at MD Trader we always wait patiently for a pullback towards our level/ribbon so that we mitigate our risk/reward ratios to be in our favour
- The initial pull back to the level failed and ultimately closed below the level, however there is a nuance here to note. The level and the ribbon were very close together. When the ribbon and the level are close together it is appropriate at the discretion of the trader, to now use the 13EMA on the ribbon as their risk, or to cut the position on the close below the level.
- Here we see $META fails the levels on the initial pull back but then continues to hold the 13EMA for a push back up towards the level, ultimately reclaiming it, and pushing towards the next resistance.
SYSTEM SHORT SET UP
The system short set up is the inverse of the system long set up and is based upon the levels and the ribbon. In the system short set, up we are looking to take a short position at an identified level of resistance or in a down trending ribbon that is consolidating above below/above resistance.
SYSTEM SHORT SET UPS
- Conditions
- Break below identified support (Mandatory)
- Bearish trending 10-minute ribbon (Mandatory)
- TTM Squeeze (Optional but ideal)
- Entry
- On a pull back to the resistance level
- Pull back to 8EMA or 13EMA 10Minute ribbon
- Risk
- Close above resistance level if far from ribbon
- Close above 13EMA 10Minute ribbon if level and ribbon close
- Take Profit
- At next support level, ATR or identified in Pre-Market
- Close above 13EMA if riding the trend
$META JULY 1 SHORT WITH LEVEL

Ticker Context: $META was bearish on the 4H, 1H, and 10M chart coming into market open. The pivots for shorts were 505.46 and 501.82. with a target of 494.80
- Into open $META was breaking our primary pivot but not yet our pivot to enter the trade for shorts, and met the condition of having a trending bearish 10M ribbon
- A sharp move down closed below the level and the next candle had a slight pull back to the level as illustrated by the wick before making a sharp move down
- This entry required the trader to remain focused and vigilant for the pull back to the level, rather than chasing the sharp move down.
- Risk on this trade was a close back above the level, as this would have shown the level acting as support as opposed to resistance.
In conclusion, the trading tools discussed, including the SATY ATR Levels, SATY Pivot Ribbon, TTM Squeeze Pro, Premarket Highs and Lows, and Yesterday Highs and Lows, offer valuable insights into intraday trading and understanding stock movement ranges. The system set-ups, encompassing the MD trader system, EMA clouds, and risk assessment strategies, provide a comprehensive framework for establishing long and short positions. The detailed analysis of specific stock scenarios, such as the July 3rd $ARM long with level and $META July 3rd long with ribbon, offers practical insights into applying these tools and set-ups in real trading situations. By integrating these tools and set-ups, traders can enhance their decision-making processes and optimize their risk management strategies for successful intraday trading.
