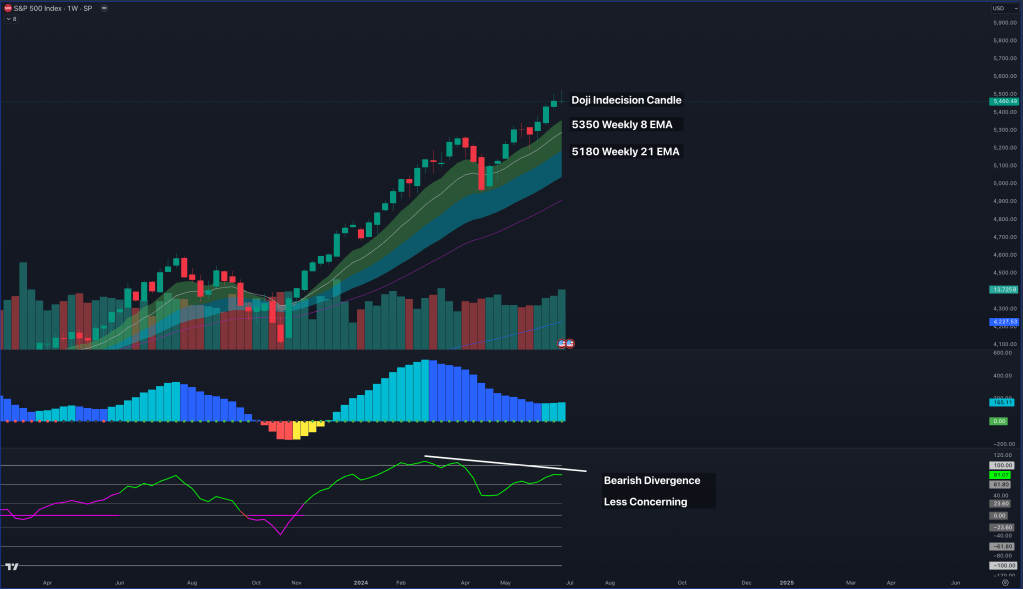
Weekly Chart
Indecision Candle
This week, we observed an interesting candle on the weekly chart with a long upper wick. The price failed to sustain the breakout above the all-time high of 5500, closing within the range of the previous week’s candle. This is often referred to as a DOJI or an indecision candle, indicating that neither buyers nor sellers could take control. Typically, this signals a potential pullback for a weekly mean reversion.
Mean Reversion Targets
For a weekly mean reversion, the first target is the 8EMA around 5350, followed by the 21EMA around 5180. These levels may adjust with new price action, so we will refer to the daily chart for updated guidance.
Bearish Divergence
It’s also important to note the confirmed bearish divergence on the weekly chart, with price making higher highs while our momentum indicator shows lower highs. However, based on historical bull market charts, this isn’t a major cause for concern or indicative of a significant pullback.
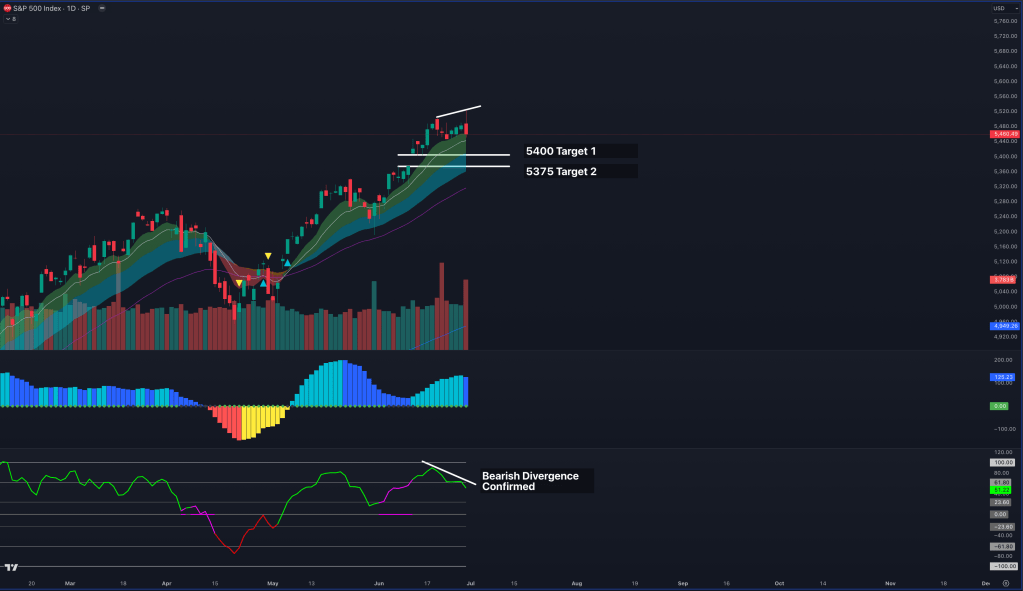
Daily Chart
Mean Reversion
Friday’s price action tested the 8EMA and confirmed a bearish divergence, with price making higher highs and momentum showing lower highs. This divergence on the daily chart is more telling and indicative of a potential pullback.
Pullback Targets
Two main zones of interest for a pullback are 5400, aligning with the 21EMA and the top of our CPI gap, and 5375, our gap fill target coinciding with the 34EMA. These zones are critical for support as buyers are expected to step in.
Bull Market Context
We’re still in a bull market, and until the weekly ribbon flips to a bearish structure, the broader bias remains upward. However, the daily ribbon suggests opportunities for intraday downside moves.
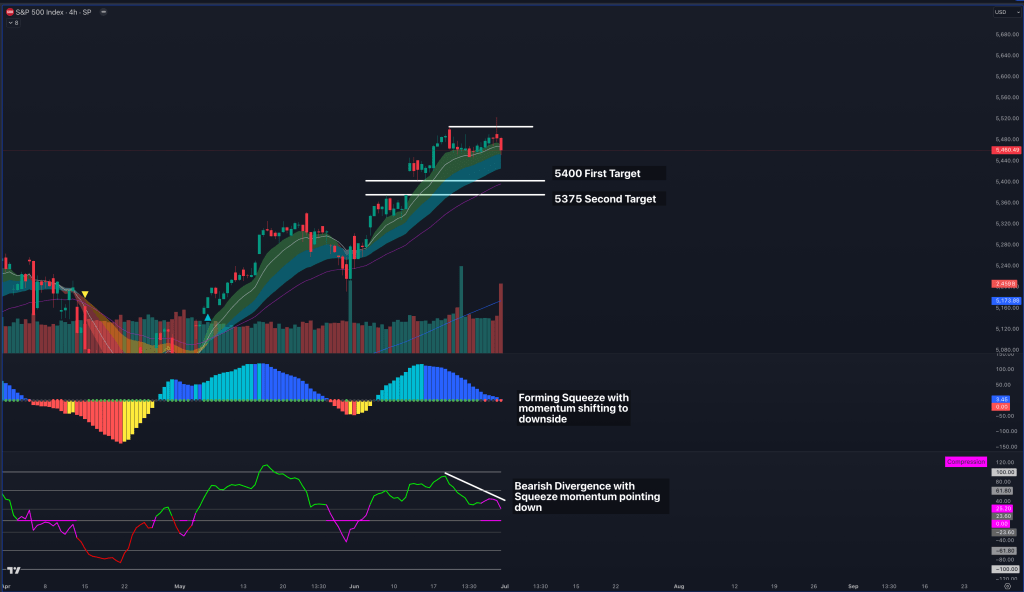
4 Hour Chart
4-Hour Time Frame
Intraday Structure
On the 4-hour chart, cracks in the structure are apparent. We’ve closed below the 13EMA and are testing the 21EMA. A breakout below the 21EMA could trigger a larger pullback to weekly support and potential gap fill.
Bearish Divergence and Support Levels
The bearish divergence is more pronounced on the 4-hour chart, indicating a price squeeze with momentum shifting downward. The 48EMA, coinciding with the gap fill, is a key support level to watch for buyer activity to continue the bull market.
Conclusion
In summary, while the weekly chart shows indecision with a DOJI candle and confirmed bearish divergence, the daily and 4-hour charts provide more immediate signals of a potential pullback. Key support levels at 5400 and 5375 will be crucial to watch in the coming days. Despite short-term bearish signs, the overarching bull market structure remains intact, offering opportunities for strategic intraday trading.
