Key Variables to Watch
Weekly Candle Patterns: Monitor any continuation of bearish patterns or a potential reversal.
SATY Phase Oscillator: Watch for confirmation of bearish divergence on both weekly and daily time frames.
Support Levels: Key levels include 531.29 (weekly mean reversion target), 539.5 (daily pivot), and the 48 EMA on 4H.
EMA Closes: Observe 4H closes below the 13, 21, and 48 EMA for confirmation of trend changes.
Momentum Indicators: Track the squeeze momentum and the oscillator patterns, especially any formation of IHS on the 1H.
CPI Gap Fill: The potential gap fill to the Daily 21 EMA if the reversion continues.
Weekly Time Frame
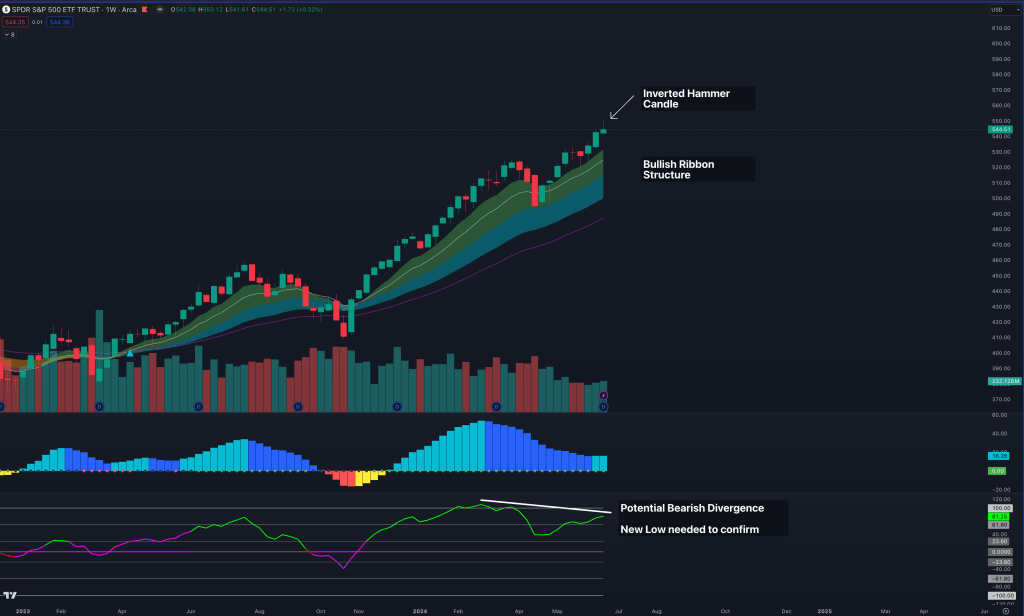
Last week we printed an inverted hammer or a shooting star candle, regardless of how you classify the candle, sellers took control of the action resulting in a long wick, indicating a potential weekly mean reversion is in play.
It is important to note that the weekly time frame is still very bullish and is in a clear uptrend, thus making shorts still a play that should be taken with caution.
It is interesting to see that on the SATY Phase Oscillator we are beginning to see a potential bearish divergence with price making higher highs, yet the oscillator making lower highs, this week will confirm if this is a true bearish divergence.
Weekly Mean Reversion Target would be 531.29, but there is still plenty of support to move through until we get there, and we will use lower time frames to guide this potential move down.
Daily Time Frame
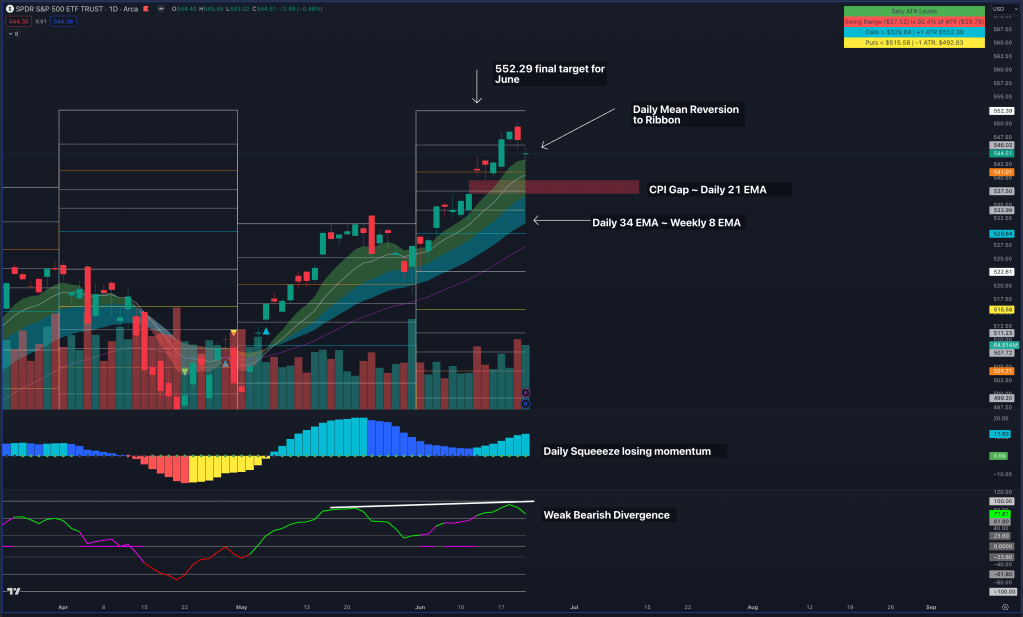
The Daily Time Frame has started to begin its mean reversion with a test of the 8EMA going into OPEX Friday. It is still important to note that we are still in a strong uptrend on the daily time frame with higher lows and lower highs, and a stacked bullish EMA ribbon.
However, it is important to note that we are nearing the end of the upside range for the month of June with only ~50 cents away from the monthly upside ATR level.
The CPI gap still looms below and a reversion to the Daily 21 EMA will result in us filling this gap, with the key pivot being 539.5 to fill the gap.
It is also important to note that the daily squeeze we have fired is beginning to lose momentum, and that we are putting in a weak bearish divergence on the oscillator with price making higher highs, and the oscillator making equal highs.
In order to play a potential Daily/Weekly Mean Reversion we will look to the 4H and 1H EMA’s to guide this move down.
4H Time Frame
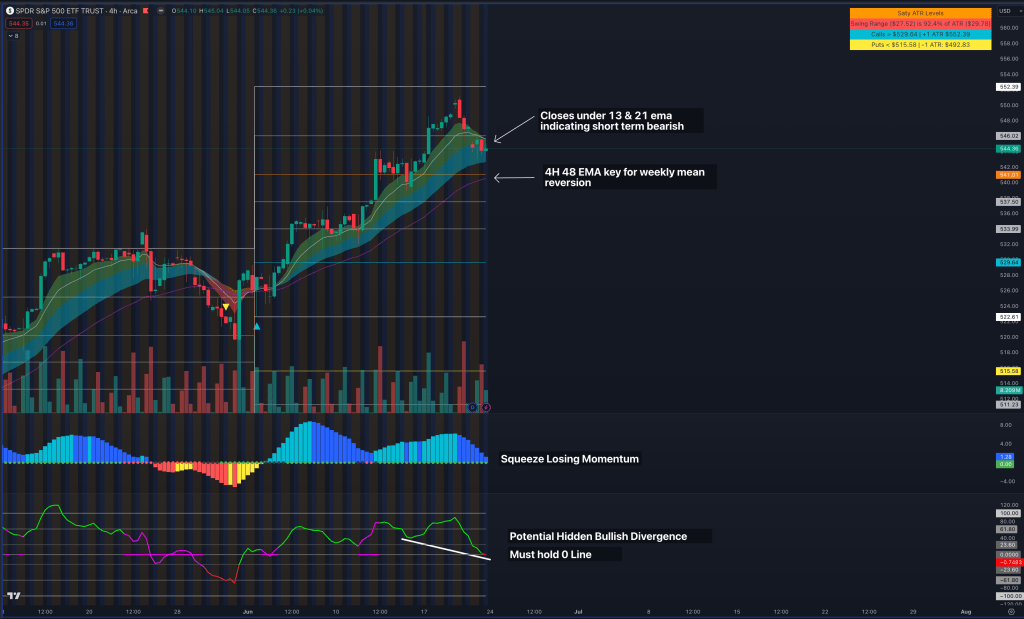
The 4H Time frame is where we are beginning to see cracks in the short term uptrend, with official closes below the 13 and 21 EMA. The 48 EMA will be our key pivot to indicate that we are truly beginning a Daily and Weekly Mean reversion which will give us more confidence to take intraday shorts.
Its also important to see that the squeeze that we have fired is beginning to lose momentum, alongside the SATY Phase Oscillator confirming a bearish divergence with recent highs in price matching up with equal highs on the indicator.
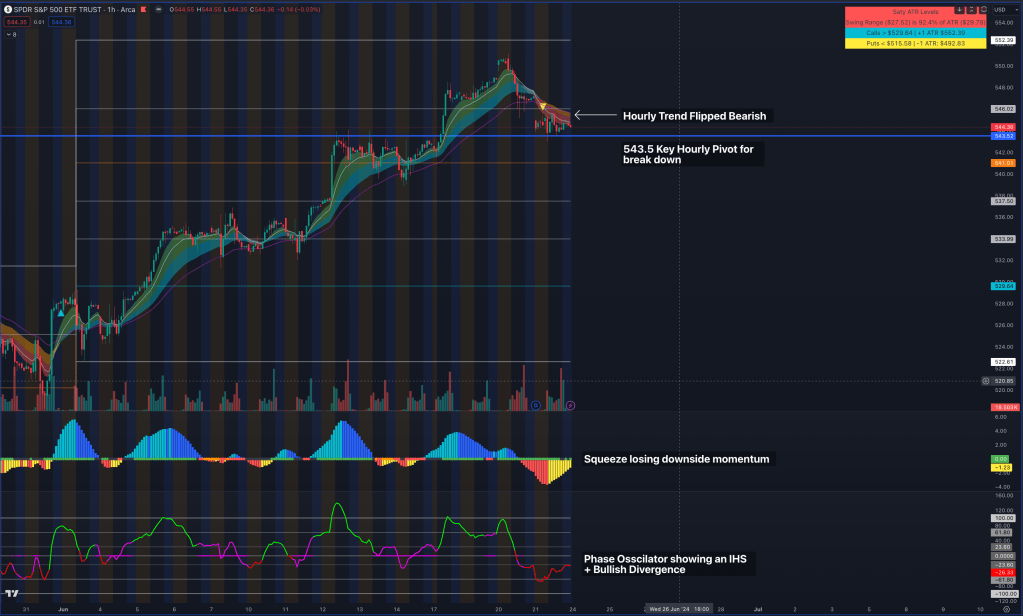
1H Time Frame
The 1H time frame guides many of our intraday moves and it has officially confirmed a bearish trend with the 8-48EMA’s stacking in a bearish formation. Its important to remain cognizant of the higher time frame supports especially the 48 EMA on the 4H mentioned above.
There are a few mixed signals with the oscillator and the squeeze. On the squeeze down we are beginning to see it lose momentum and potentially shifting back to the upside. On the oscillator we are seeing a potential IHS, which in the past has proven to be a playable structure. If the bull case is present with the oscillator I would not be surprised to see us retest the 48EMA on the hourly for a potential reclaim of bullish structure, in which shorts will become invalid.