Key Variables to Watch
Weekly Candle Patterns: Monitor any continuation of bearish patterns or a potential reversal.
SATY Phase Oscillator: Watch for confirmation of bearish divergence on both weekly and daily time frames.
Support Levels: Key levels include ~461 (weekly mean reversion target), 471.25 (daily pivot), and the 48 EMA on 4H.
EMA Closes: Observe 4H closes below the 13, 21, and 48 EMA for confirmation of trend changes.
CPI Gap Fill: The potential gap fill to the Daily 21 EMA if the reversion continues.
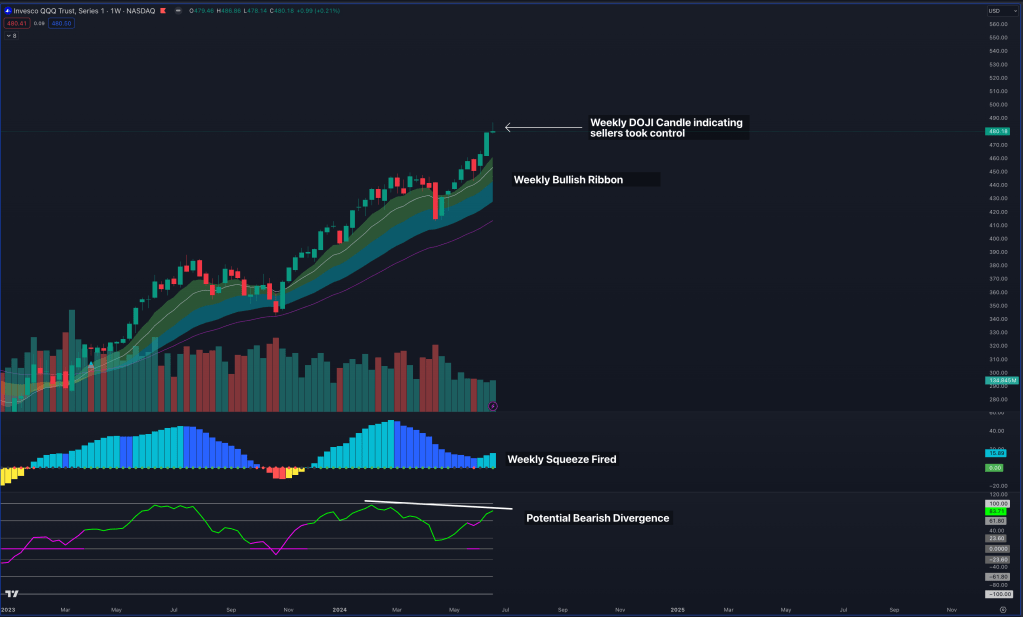
Weekly Time Frame
QQQ this OPEX week printed a weekly candle with a long upside wick indicating that we may see a move back down as sellers took control into the end of the week.
Its important to also note that we are seeing a potential bearish divergence on the oscillator with price making higher highs and the oscillator making lower highs, however this divergence will be either validated or invalidated with this week’s price action.
We are also seeing a mixed signal on the squeeze indicator showing that the squeeze we were forming is firing to the upside, but this can also flip with momentum pushing back down.
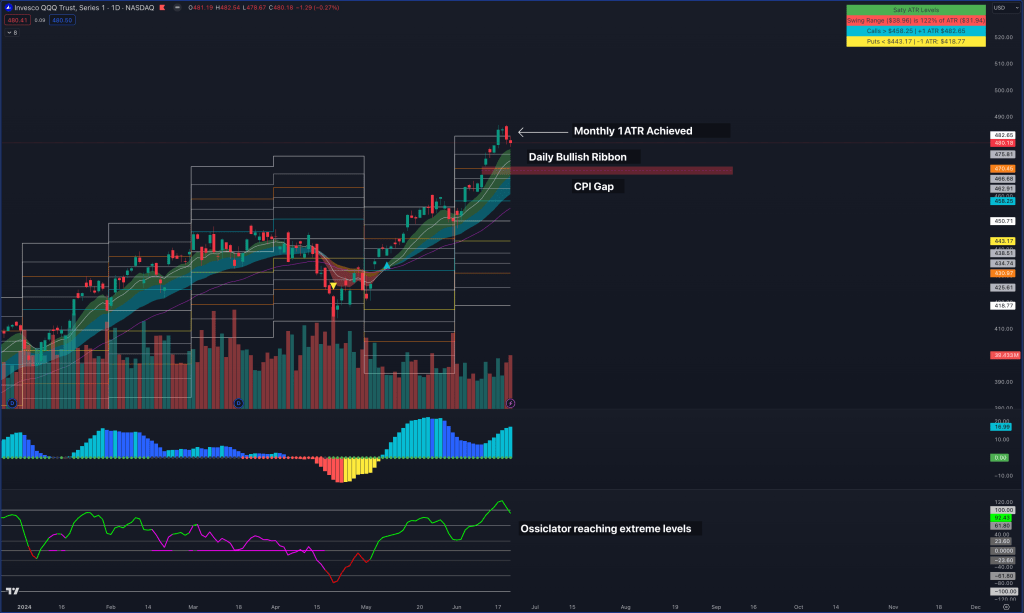
Daily Time Frame
This week we achieved +1 ATR for the month of June and began rejecting that level going into OPEX Friday. Viewing the ribbon we are still in a short term and longterm up trend with the EMA’s remaining all stacked to the upside, indicating continuation of bullish momentum.
However with recent price action it is possible that we can see the move down to come test the 8EMA if the lower time frames begin to shift into a bearish formation. We still have the CPI Gap looming below, with a fill of this gap taking us down to the Daily 21 EMA.
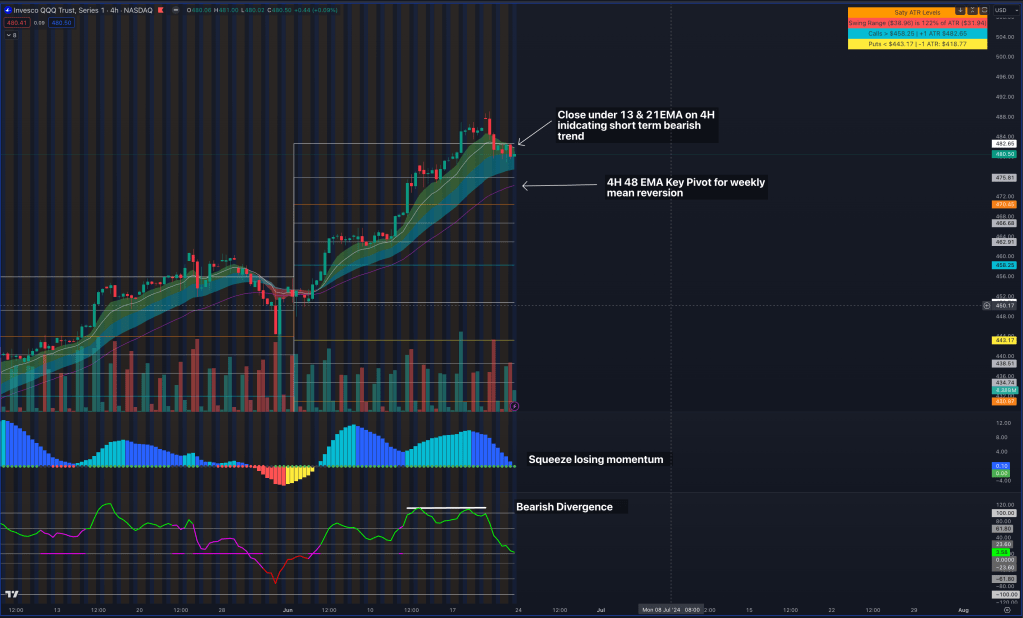
4H Time Frame
The 4H time frame is where we are beginning to see cracks in bullish structure with price closing below both the 13 & 21 EMA’s.
If price continues to move down we can very well see us go down to test the 48EMA which will be our key pivot to indicate that we are beginning a weekly mean reversion for which the target will be ~461.
It is important to note that we have confirmed a bearish divergence on the oscillator with price making clear higher highs, but the ossiclator remaining at equal highs. We also see the squeeze beginning to lose momentum to the upside and is starting to shift the histogram to the downside.
The 4H ribbon should be continued to be monitored as a close back above the 13 and 8 EMA will indicate that price is respecting the overall bullish trend that we are in.
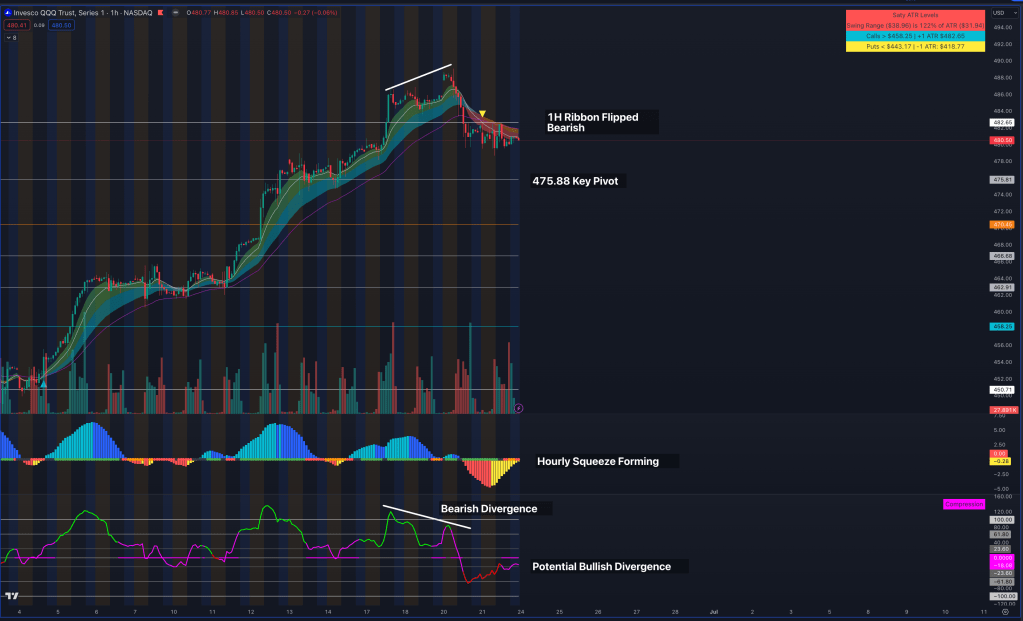
1H Time Frame
On the 1H time frame we are starting to see bearish ribbon structure with the 8-48EMAs stacking to the downside.
It is also important to note that on the SATY Phase Oscillator we are seeing a potential bullish divergence which can indicate a retest of the 48EMA, and if we close back above this, the short term bearish trend will be invalidated.
Looking to the squeeze we are forming a squeeze with momentum shifting back to the upside and this will be key to watch as this firing to the upside can indicate that we are invalidating the short term down trend. 475.88 will act as a key pivot to watch for continuation of the move down and trigger our weekly mean reversion.