Weekly Time Frame
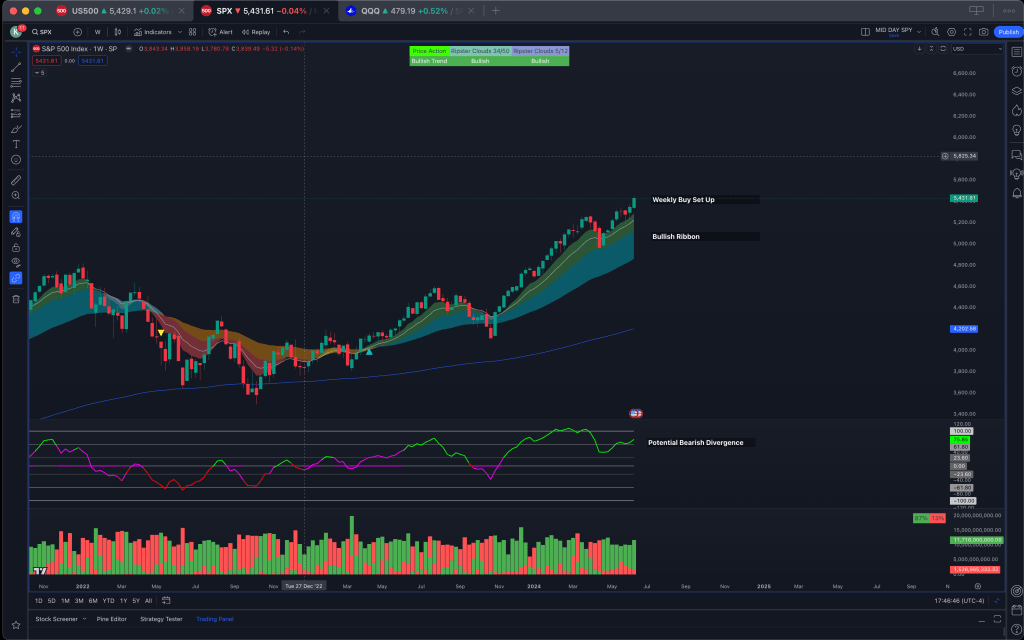
On the weekly time frame we continue to see bullish structure remain with the EMA clouds. We saw a break of last week’s highs via the CPI move that pushed us to all time highs. I would like to note that there is a potential bearish divergence on the Phase Oscillator which can indicate a potential pull back to the ribbon, however this is only one bearish signal on the chart, amongst many bullish signals for continuation.
Daily Time Frame
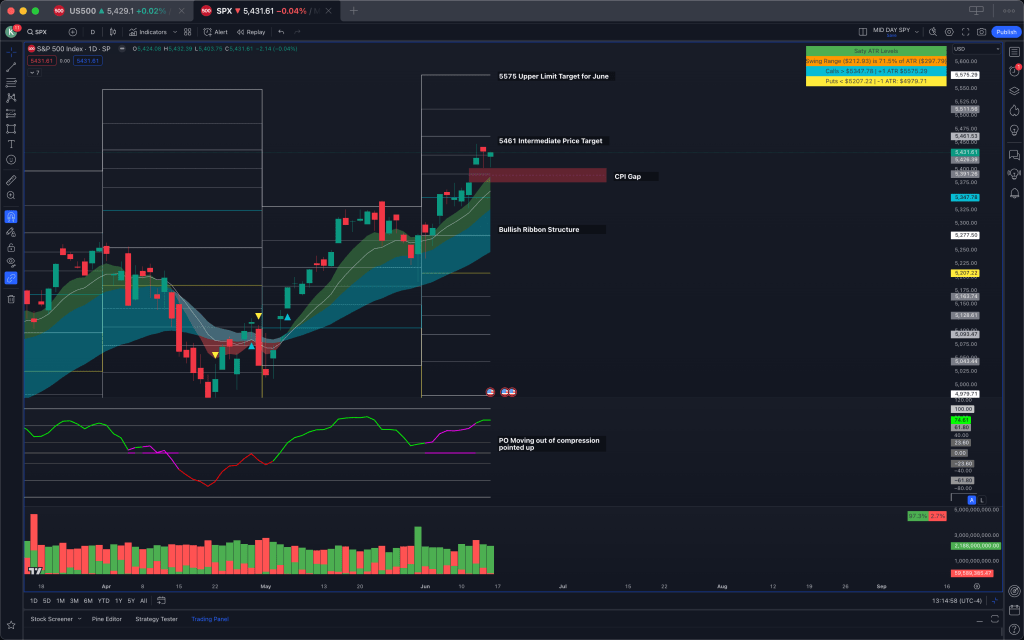
On the daily time frame we continue to see bullish cloud structure remain. It should be notes that once again there is a potential bearish divergence on the daily time frame with the phase oscillator failing to make new highs despite price making new highs. We have the CPI gap looming below, which with a gap fill would be a very healthy retest of the daily EMA’s. The upside move for the rest of the month is capped at +1 ATR which is 5575.
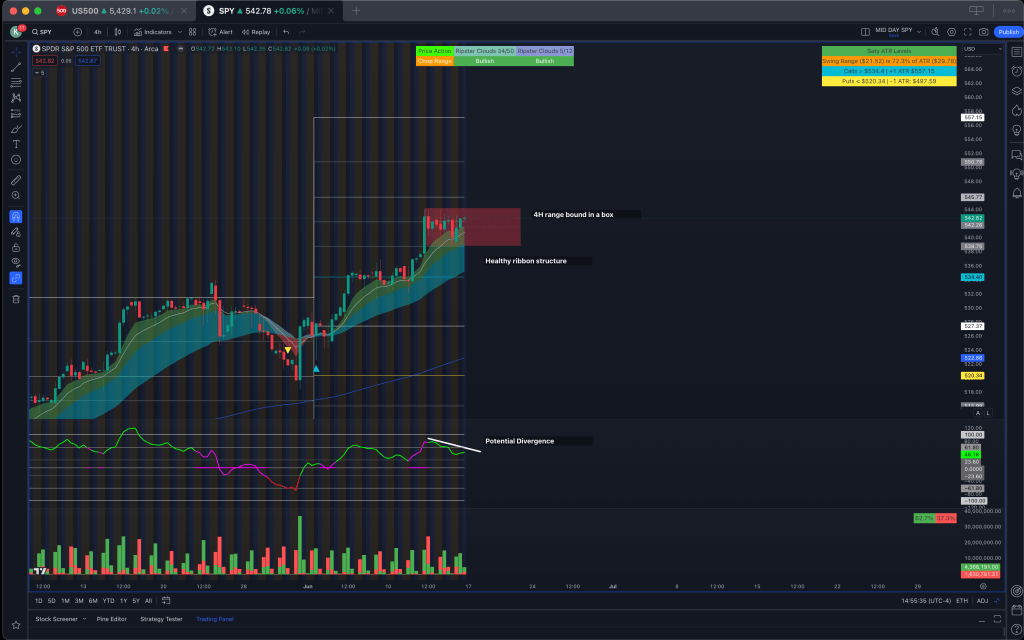
4H Time Frame
The 4H time frame is one of great importance as it shows us that we are currently consolidating within a box on SPY. Following the CPI move we have not yet had the ability to move past all time highs, which is to be expected given such a volatile move up. In order for SPY to see any movement either to the downside or the upside we should be prepared to watch this consolidation box break. Once again it should be noted that we have a potential bearish divergence on the phase oscillator, as it is showing lower highs, despite price maintaining relatively equal highs.
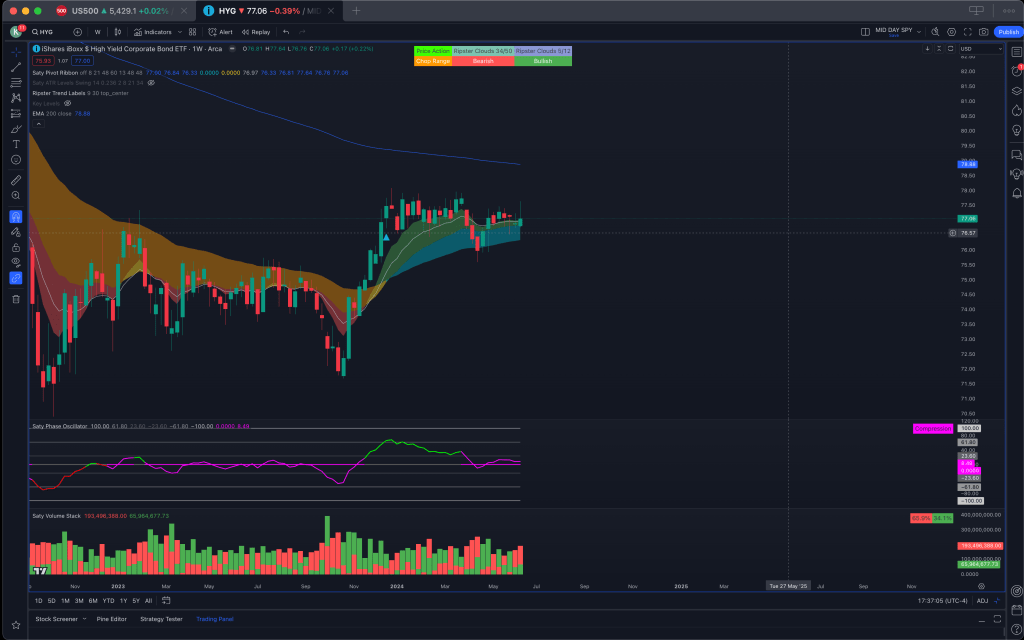
HYG
HYG on the weekly time frame remains to have to bullish structure but once again the pivot of 77-78 must be broken for us to continue to see that investors have an appetite for risk.