Daily Time Frame
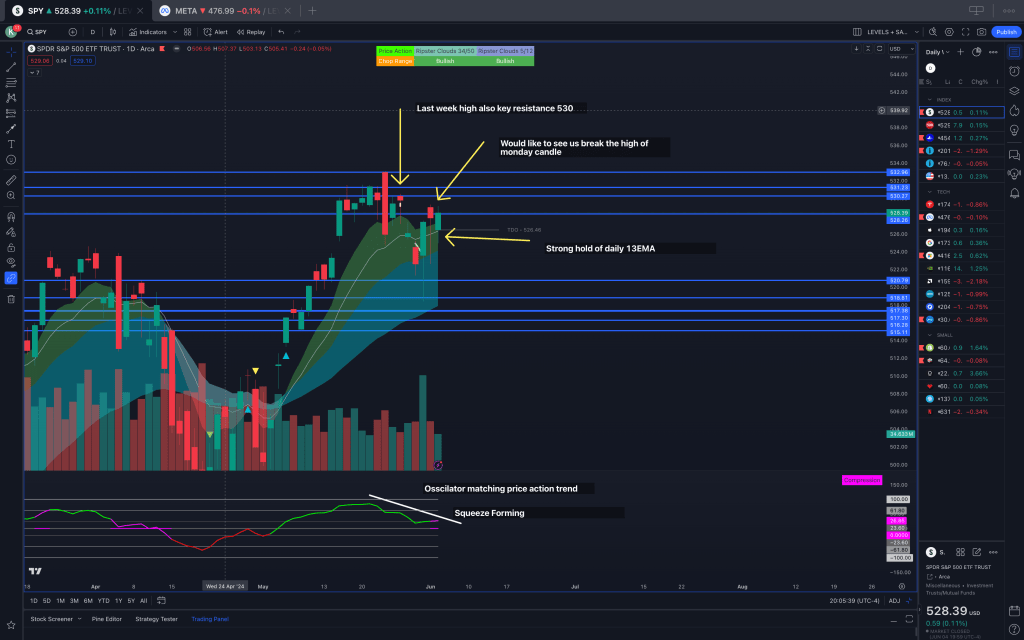
The daily time frame continues to show strength, with the ribbon respecting the EMAs. This ongoing respect indicates a robust bullish trend, suggesting that dips to these EMA levels can be viable buying opportunities when confirmed by lower time frames.
Key points of resistance to watch are:
- 529~530 Zone: This area coincides with Monday’s High and Last Week’s High, making it a critical resistance level.
Additionally, the oscillator is forming a squeeze, which, combined with the absence of divergence between price action and momentum, supports the likelihood of continued bullish movement.
4HR
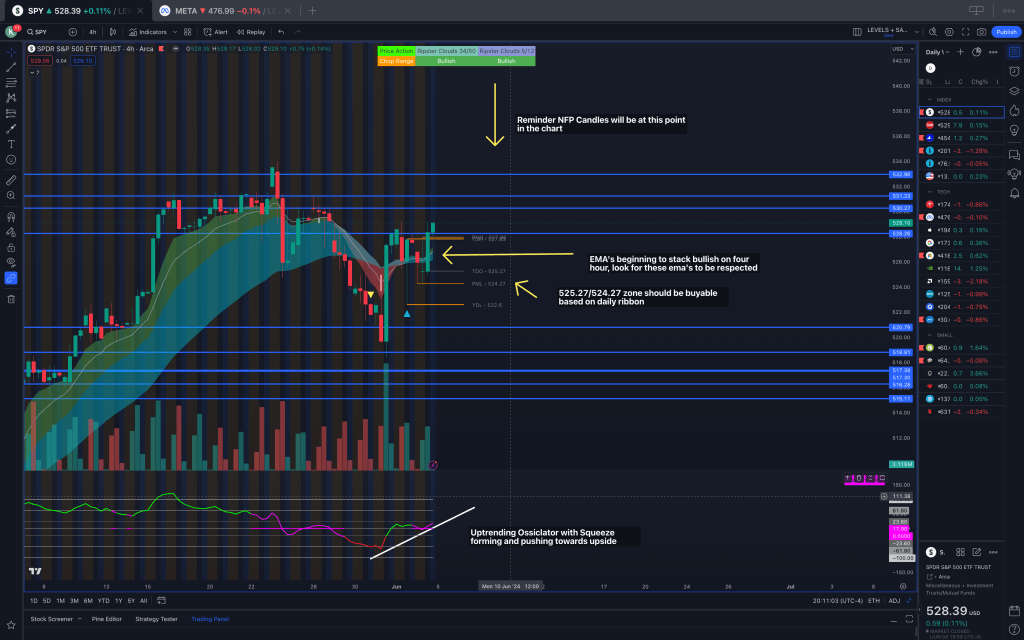
The 4-hour chart provides further insight into the bullish trend. The ribbon’s EMAs are starting to stack in a manner favoring a bullish outlook. However, guidance from the daily time frame remains crucial until the ribbon stacks more cleanly.
Key observations include:
- Oscillator Uptrend: The oscillator is forming a squeeze and is currently positioned towards the upside, indicating potential bullish momentum.
- High Volatility Event: The upcoming Non-Farm Payrolls (NFP) report on Friday is a significant event that could introduce high volatility. The market might be in a holding pattern until this report is released, possibly making a move towards the all-time highs at 532 thereafter.
1HR Time Frame
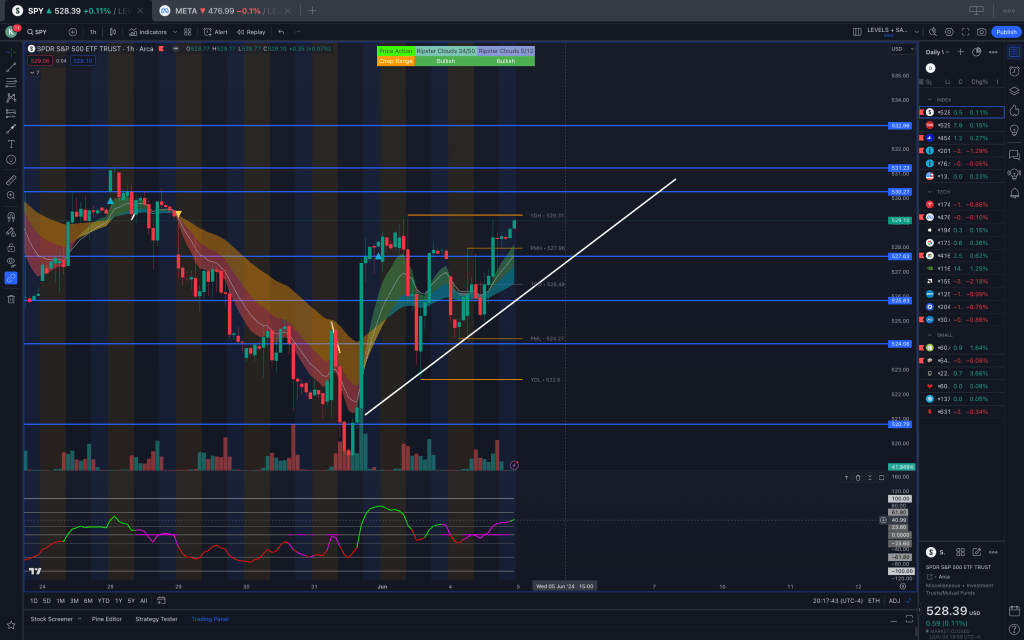
The 1-hour chart reveals a clear uptrend, marked by a well-defined trendline. This time frame also presents a visualizable box pattern between the low of 523 and the high of 529.
Expectations for price movement are:
- Upside Target: The trend suggests a potential move towards 531.
- Pullback Scenarios: There could be a pullback to the trend line at 525 or a further dip to the low of 523, corresponding to the bottom of the box.
Strategic Implications
Given the analysis across these time frames, the following strategic approach is recommended:
- Monitor Key Resistance Levels: Pay close attention to the 529~530 zone on the daily chart. A break above this level could signal further bullish movement towards the all-time highs at 532.
- Leverage Lower Time Frames for Entries: Utilize the 1-hour and 4-hour charts for precise entry points, particularly around the EMAs and key trend lines.
- Prepare for Volatility: Be mindful of the NFP report on Friday. This high-impact event could drive significant market moves, providing opportunities but also necessitating careful risk management.
