Lets Look Back to Last Week
Above you can find the link to last week’s market outlook, the key aspect to focus on is the power of Multi Time Frame Analysis. Utilizing all aspects of the chart allowed us to create a hypothesis on a potential pullback to the weekly cloud (see reference below), and we were able to stay vigilant and ensure our bias was neither too bullish nor too bearish. Enough about last week’s outlook; let’s move on to this week.
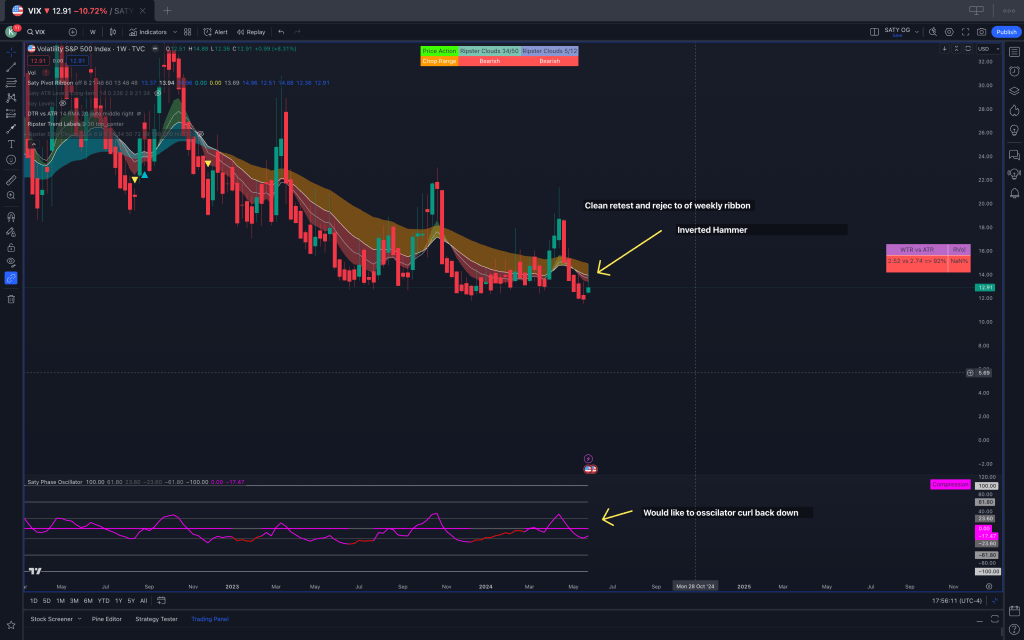
Weekly Time Frame
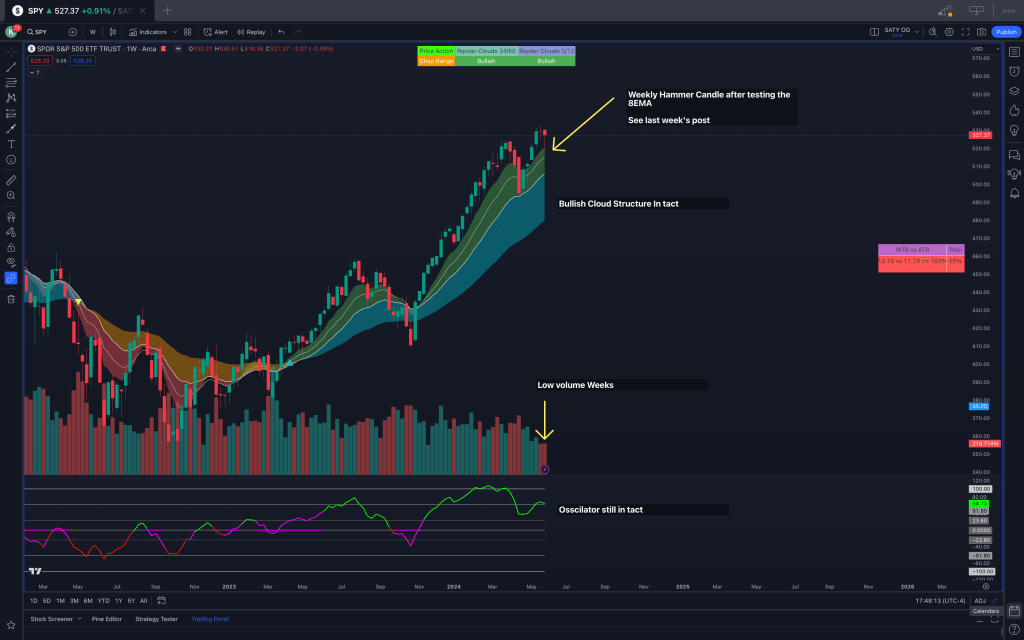
The weekly candle we just put in is very interesting, we put in a low volume hammer candle off of the weekly 8 EMA. I’m not a fan of setting a bias just based on candle stick patterns or volume, but it’s important in the grand scheme of the chart. We also see our cloud structure is still bullish, which means we would want to stay long in the medium term. With the weekly chart, I would like to see us push above the high of the candle we just put in, to signal that last weeks action was just a minor pull back, and that buyers still are in control of this market. The oscillator appears to be quite healthy as well after sustaining a pull back to support and pointing back up.
Daily Time Frame
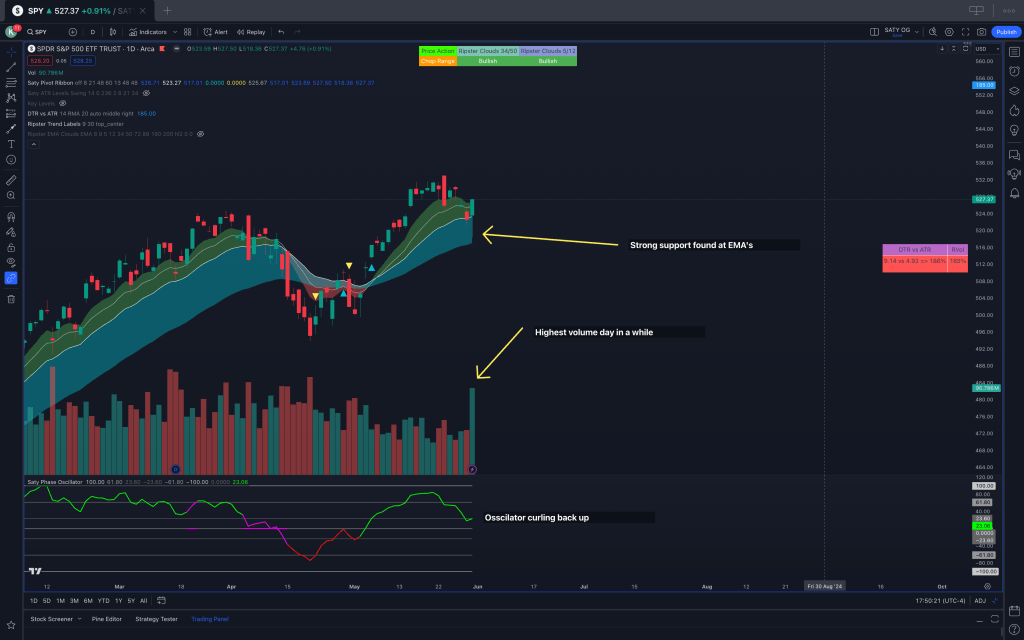
The daily time frame is where the market begins to get very interesting. Here we see a clean retest of the bottom of the cloud, and us reclaiming and closing above the 8EMA on very strong volume. The oscillator also appears to have had a healthy test of support and is now curled back up. To me this screams bullish, however we will still let the chart dictate our bias, because the 4 hour is where we execute and understand our actionable trading bias, and that is next.
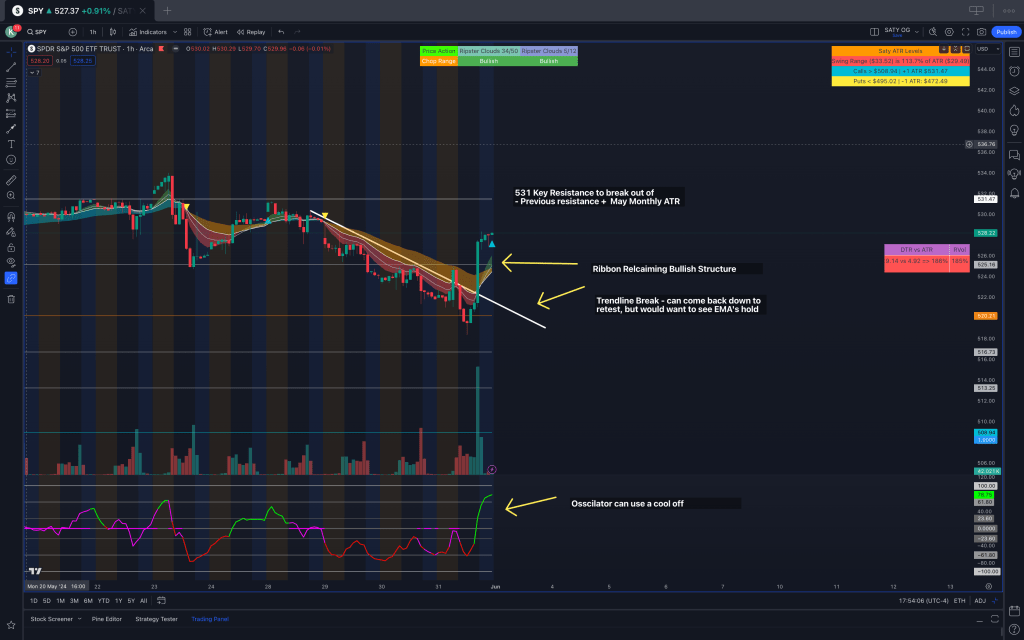
4H Time Frame
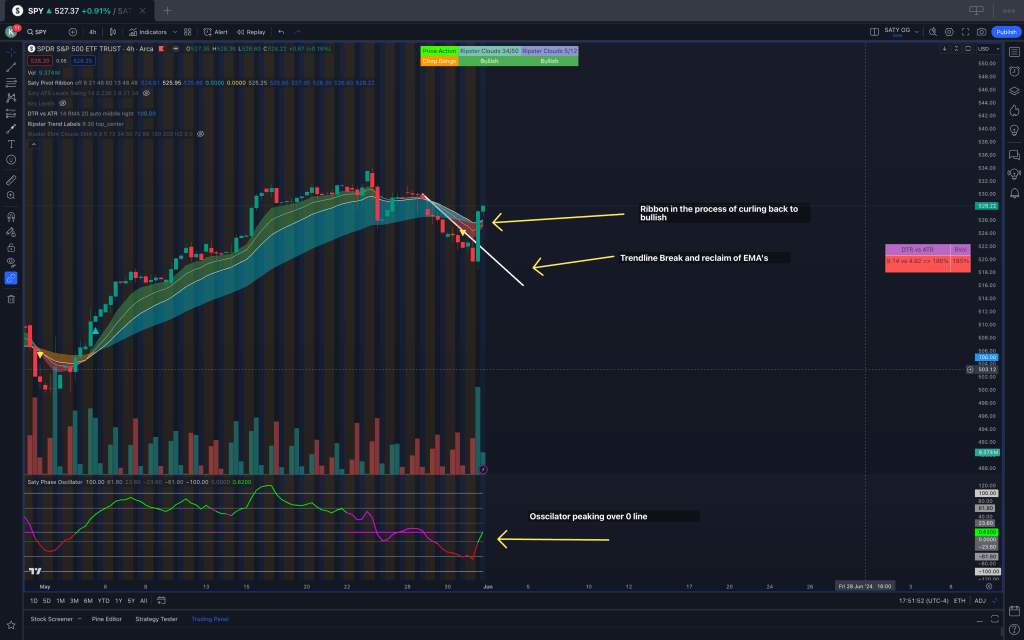
The 4H time frame shows us a very interesting picture. Here we see the bearish cloud structure starting to curling back to a bullish cloud structure, however we are not completely there yet as some of the EMA’s are still not stacked. The trendline break is very interesting as well and can give us some targets on the charts. It is possible that we pull back to the trend line which is above 521, but now that we are over the clouds we do have support that we can hold. The EMA’s on the 4H chart will be important to watch as they will act as key pivots for price. A retest of 525 would be healthy, and if is held by the hourly clouds, the retest should be bought with long calls. The oscillator is important to note here as well, it had a significant pull back and is now over the 0 line, it will be important to watch for a squeeze to form.
1H Time Frame
The hourly time frame is showing an amazing chart that show’s bullish structure is back in control. The EMA’s are curling back bullish and we see that our clouds are hovering right around the 524-525 zone which is a healthy pull back. On a deeper pull back we can very well retest the trend line, but once again there is ample amount of support we have to break through. It can be wise to wait and let the hourly chart develop before getting too biased. You can see my day to day bias in my discord which will be coming out very shortly.
VIX
VIX gave us a clean retest of the weekly ribbon and it acted as resistance as expected. Once again vix is in a strong downtrend, however, we should still keep an eye on it day to day with the pivots that we trade. You can find my SPY VIX strategy here https://mdtrader.ca/2024/05/30/spy-and-vix-strategy-capturing-market-moves/
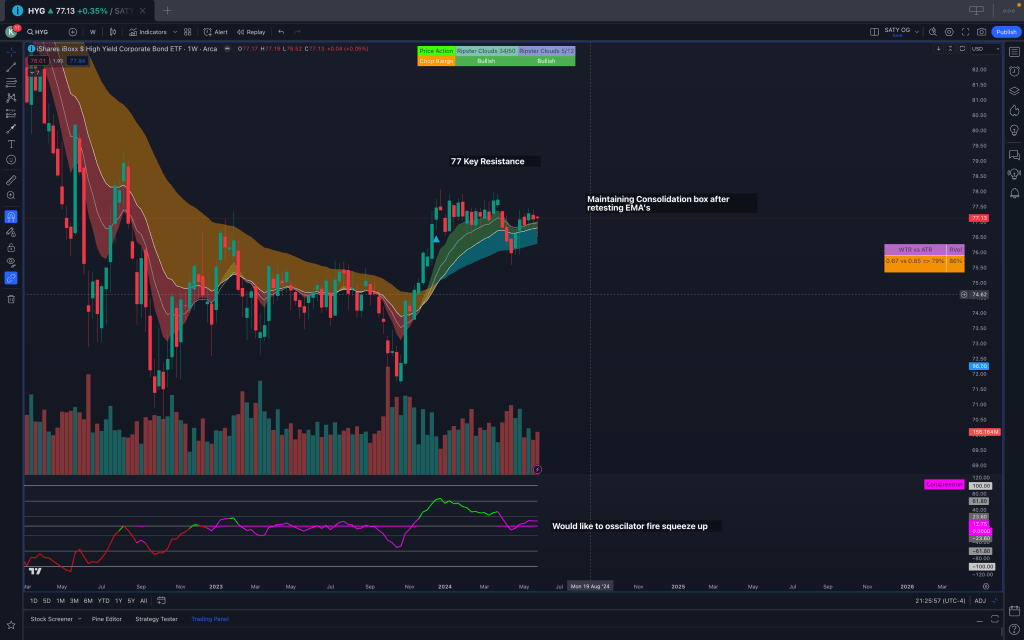
HYG
In the world of junk bonds we still clear bullish structure showing that institutions have an appetite for risk. We are still consolidating in this box, but if we break 77 with strength we can expect to see the indices to start moving bullish strongly.
Thank you again for reading this weekly market outlook, I hope they prove to be good education tools even if certain aspects of it do not play out as intended. We are students of the market and all we can do is make educated hypotheses and learn from thoughts and ideas.
Stay tuned to a link for a discord where you can get day to day updates on the market!
