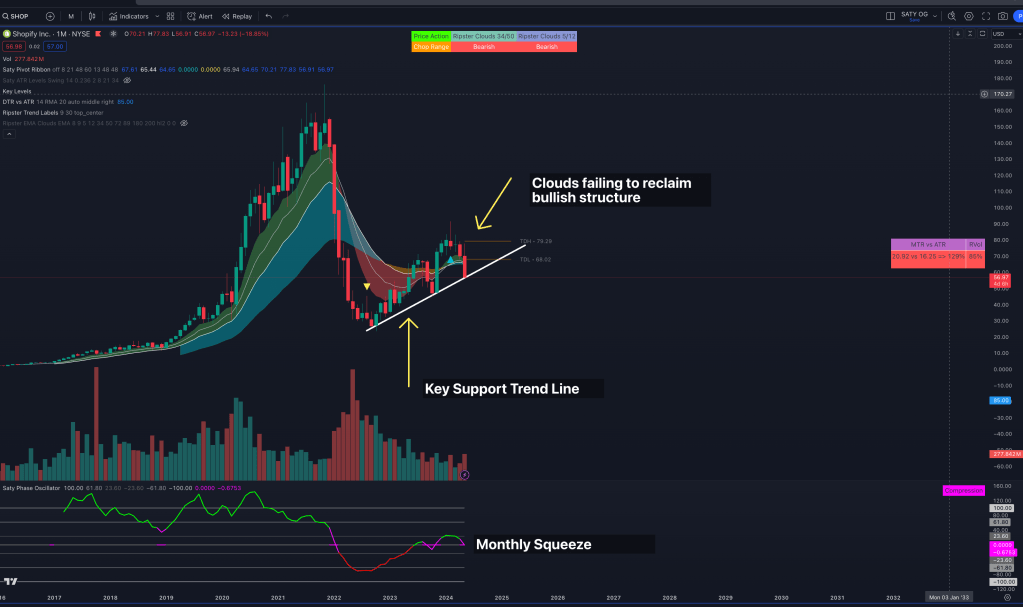
Shopify, a major player in e-commerce, has piqued our interest with a substantial change in stock trends. Following its earnings release, Shopify experienced a large-scale sell-off across both daily and weekly time frames, disrupting its bullish structure and breaking the final cloud supports of the 48EMA.
This downward trajectory has forced the stock to examine a key trendline support, shared across the Monthly, Weekly, Daily, and 4H time frames. This support level has become a critical pivot, determining the success or failure of the short position. A daily gap is evident on the chart, which could be filled if the stock price falls to 48. Another noteworthy point is the swing -1 ATR position at 54, which could lead us into the gap.
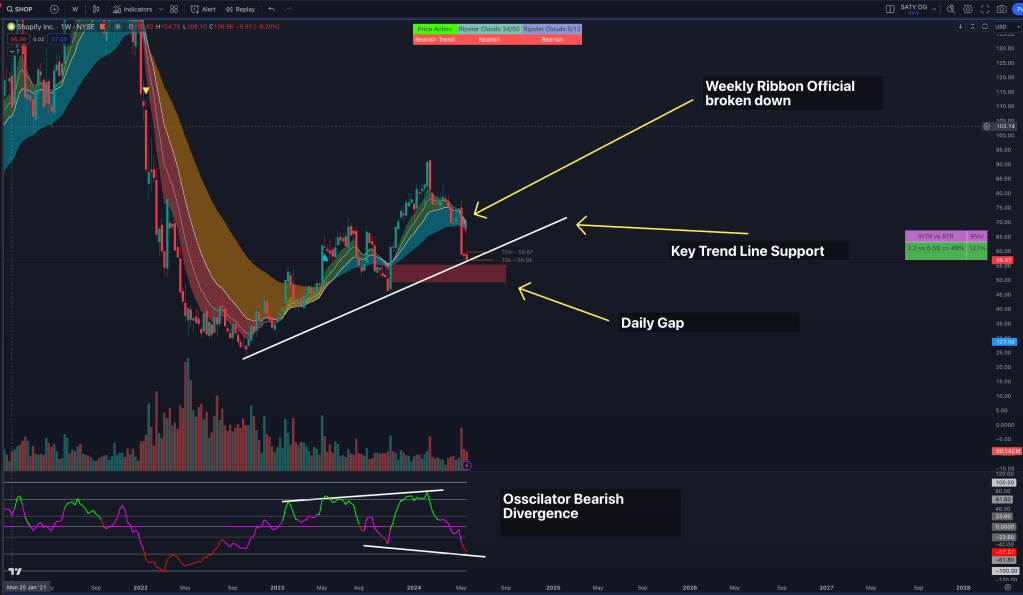
Weekly Time Frame
Upon examining the weekly time frame, the bullish cloud structure seems to be crumbling. This is backed by the stock dipping below the 48EMA and testing the key trendline support. Over the past few weeks, we’ve seen a period of consolidation and accumulation, with the price trapped between 60 and 57. The oscillator on the weekly chart also reveals a clear bearish divergence, with the price making a higher low while the oscillator makes lower lows. This indicates that the bullish trend is losing momentum.
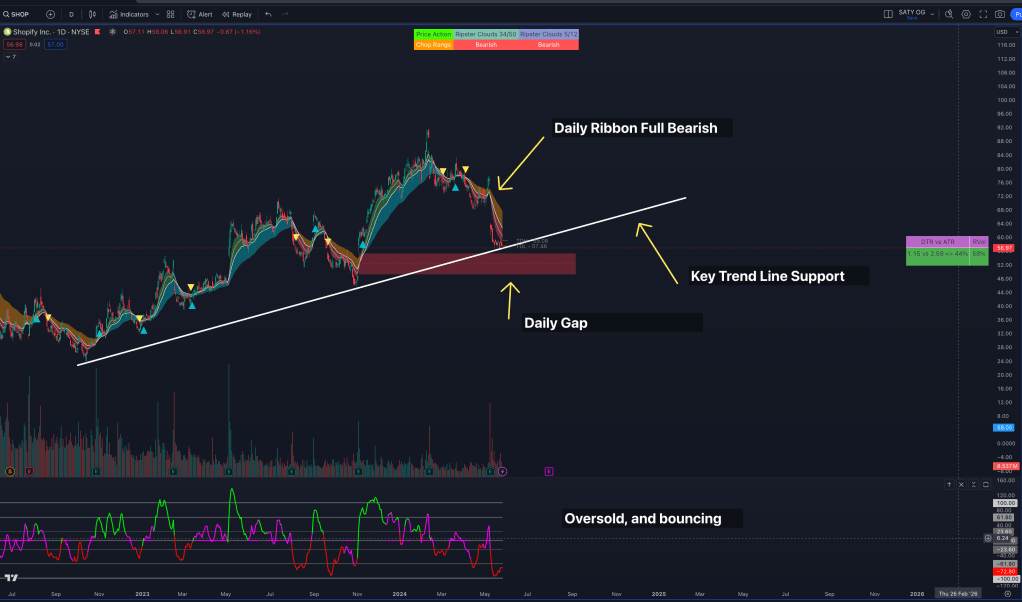
Daily Time Frame
The Daily ribbon offers a clearer depiction of the bearish trend, with the cloud structure exhibiting complete bearish parameters. The trend line support is again visible and will be instrumental in this short play. We’re expecting one of two outcomes: either the daily retests the cloud before breaking down trendline support, or we see a downward shift from trendline support. Entry points for this play will be signaled by the 4H and 1H ribbon.
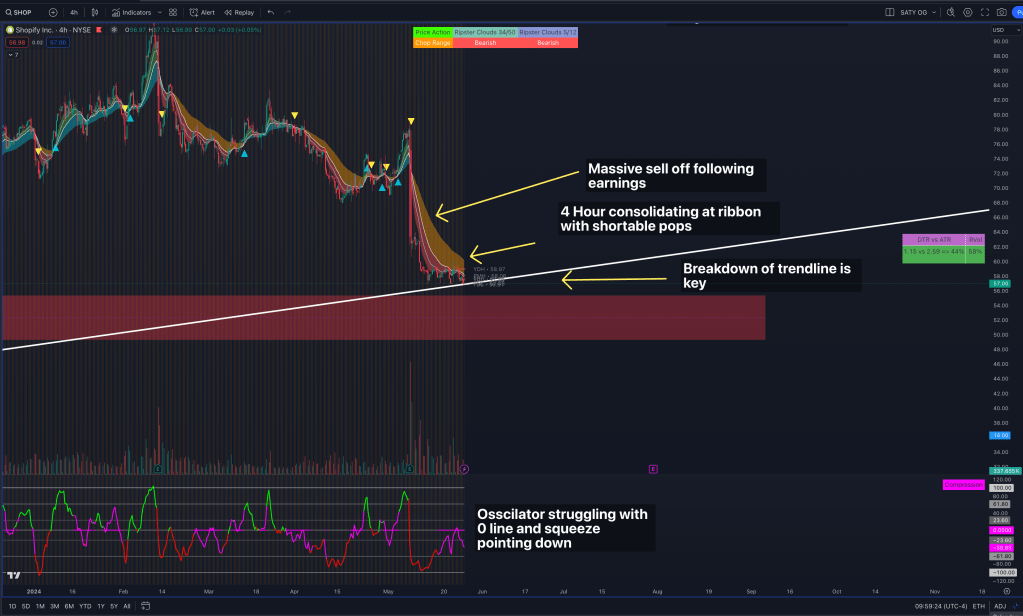
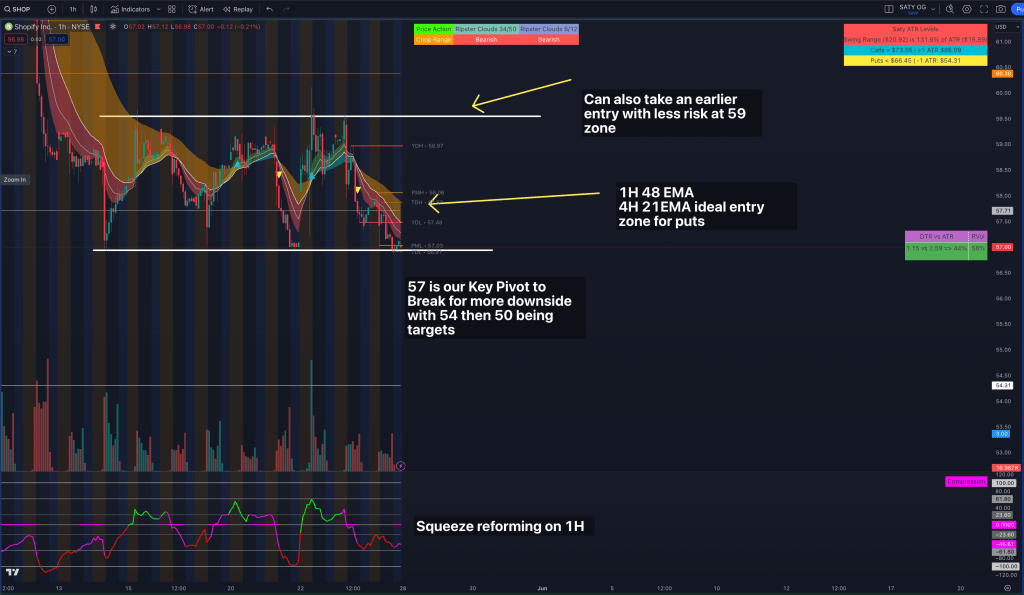
4H + 1H Time Frame
The 4H time frame underscores the consolidation box that followed the earnings sell-off. This will be an important area for timing our entries. Two potential entry points exist for this play: the 4H 21EMA, which aligns with the 1H 48EMA, or, if the price retraces further, entries at 59-60 could be ideal. A break above the consolidation box shown in the hourly chart will be our risk level, and will invalidate the play. Price targets for this play are 54, 50, and 48.
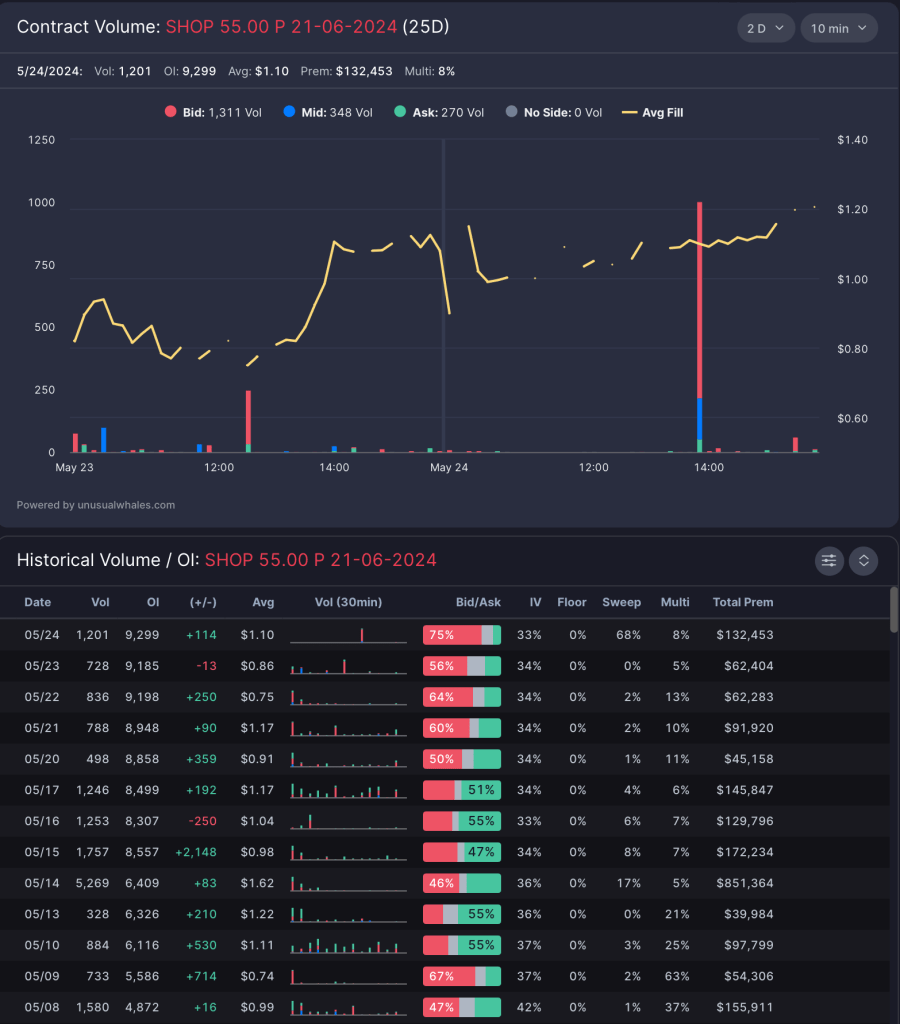
Execution
I plan to execute this play using the 55P June 21 strike. This strike has substantial open interest (OI) and volume, aiding the movement of premiums. With premiums currently low, they have the potential to rise with this play. Given the longer duration of my holding plan, profits will be rolled if price targets are met. The key is to invalidate the play above the 4H 21EMA and 1H 48EMA.
This trade idea merits close attention, and I will continue to monitor and provide updates on this Shopify stock trend study.

Leave a comment