As we dive into another week in the financial market, one of the most notable movements has been observed in Microsoft (MSFT). This tech giant has proven to be a fascinating study, displaying a unique flow and a promising trend that we will be closely monitoring.
Option Chain and Flow
Significant Option Flow
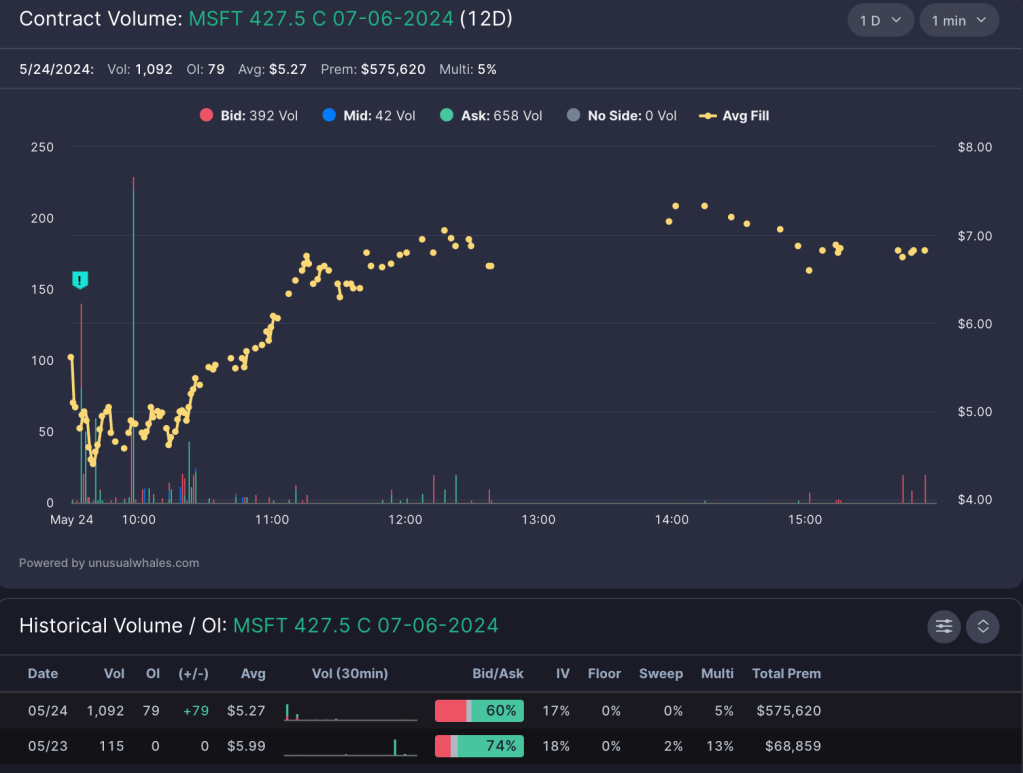
- A trader purchased 102K worth of MSFT 427.5C Long Call Options at the ask in the morning session of Friday.
- Volume on this trade exceeded open interest and was conducted at the ask, allowing for the assumption that there were true long calls BTO
- Monday will tell us if this trader is still holding the options and if these were held overnight with a bullish bias, this will be reflected with an increase in OI proportional to the volume seen.

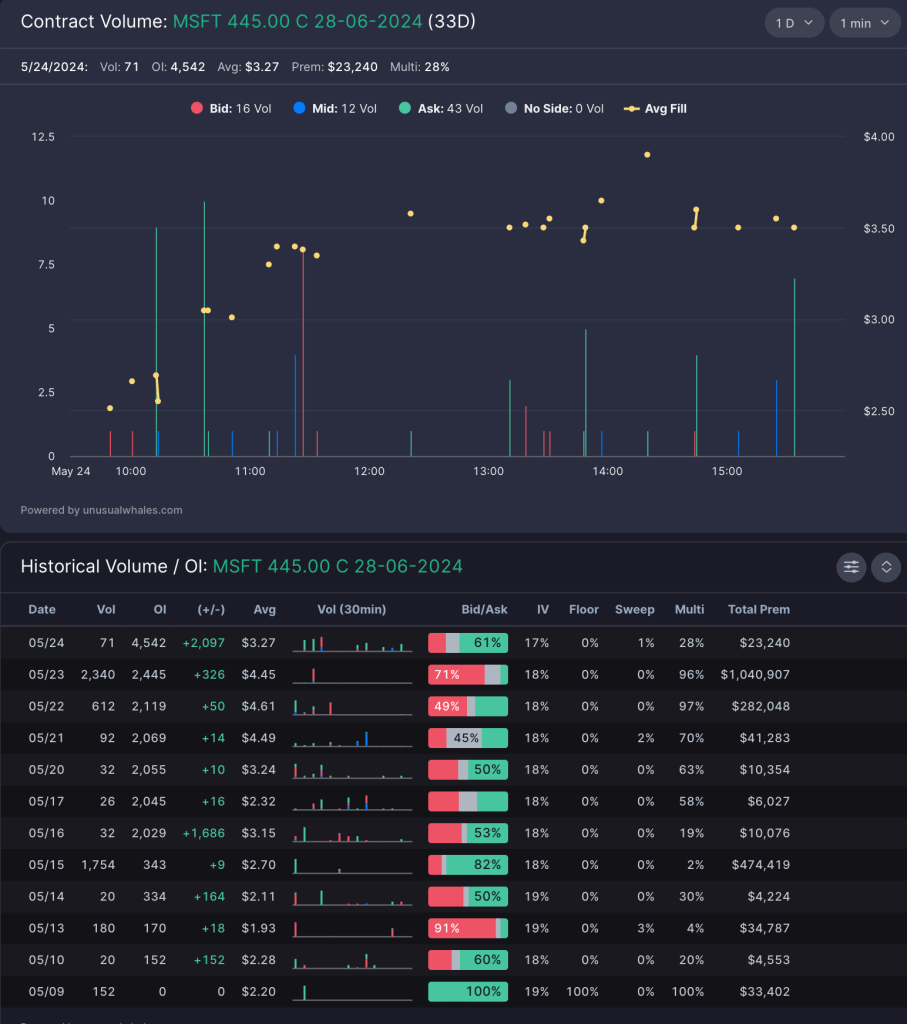
A key option chain that I am watching which follows the bullish thesis on MSFT is MSFT 445C JUNE 28. Significant options volume was targeted on this strike with large OI increases. With pull backs to the ribbon as planned in the thesis below, this will be a good strike to pick up with a bullish thesis, as there is lots of DTE to avoid theta decay and volume which can help inflate the prices of option contracts.
Weekly Time Frame
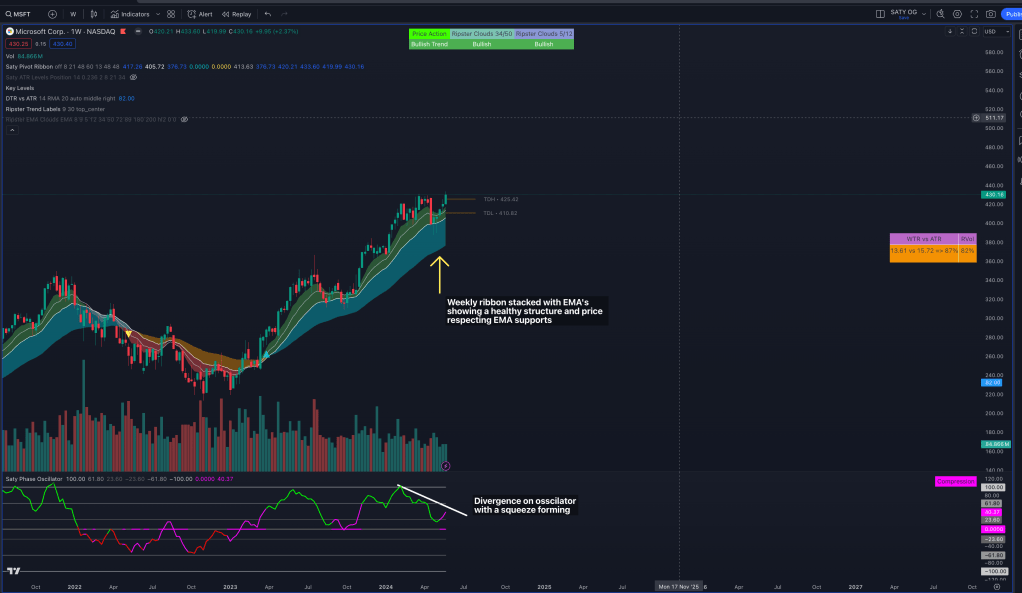
On the weekly timeframe, MSFT has been maintaining a bullish ribbon and price structure, following a retest of the weekly 21 Exponential Moving Average (EMA). The weekly squeeze is pointing upwards and seems ready to fire. This indicates a potential increase in volatility that could lead to a significant price change.
One thing to be noted is the bearish divergence on the oscillator. However, given the squeeze and the overall market conditions being compressed at the moment, this is something that can be monitored. The long-term Quarterly Average True Range (ATR) puts us at 467, indicating a significant ceiling for a potential upward move.
Daily Time Frame
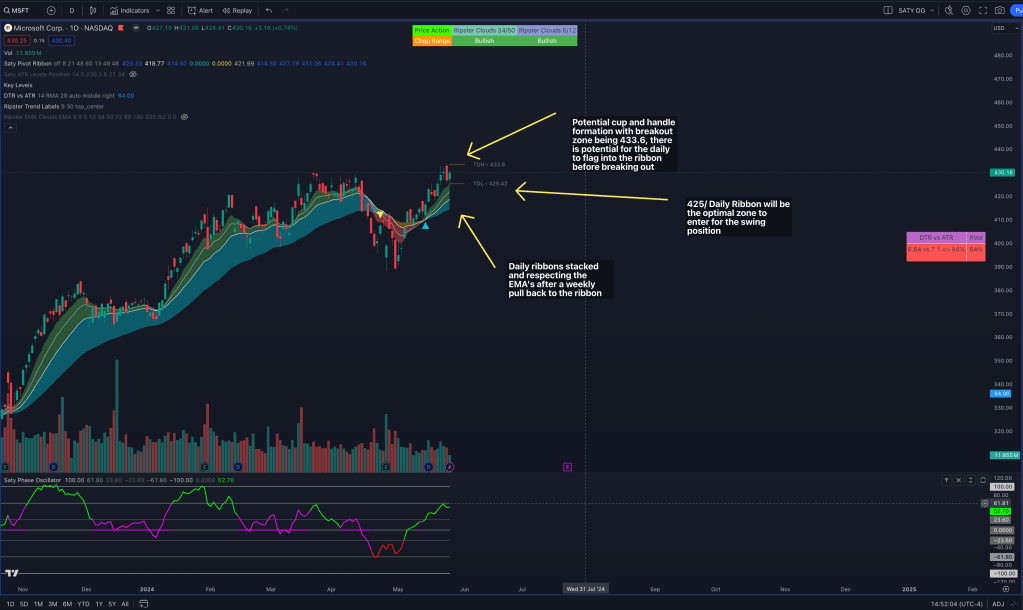
When we zoom into the daily timescale, MSFT appears to be forming a cup and handle pattern. This pattern is typically a sign of bullish continuation, hinting at potential future gains. The daily chart has made the cup after retesting the weekly 21 EMA. A handle formation down will be a retest of the ribbons, but we may break out of resistance before then, allowing us to make a move upward.
Optimal Entry and risk for the swing position will be 425 zone, with a break down of the daily 13EMA invalidating the swing
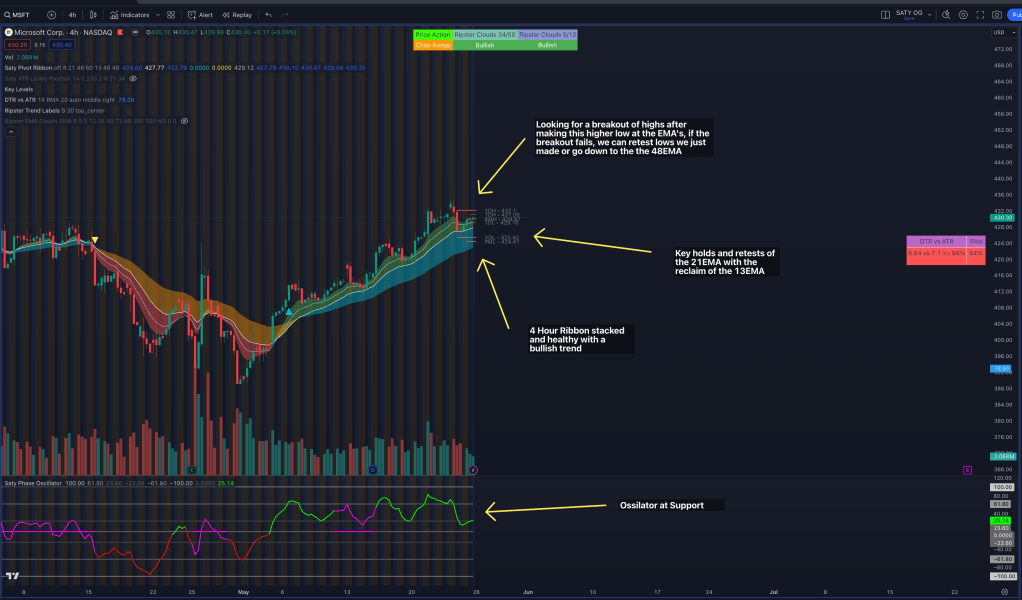
4 Hour Time Frame
On a 4-hour timeframe, MSFT continues to show bullish price action. This allows for the possibility of another leg up in the trend after retesting the ribbons. The oscillator is finding support again, indicating that the momentum could be shifting towards a more bullish market.
A few scenarios that can play out: first we can continue the bullish trend after testing the EMA’s and push higher. We can reject current EMA’s and go down to retest the 21 and 48 EMA once more, putting us in a consolidation box.
Optimal entries for the swing position will be the 427 zone ~ 4 Hour 21EMA
Conclusion
In conclusion, the week ahead looks very promising for MSFT. The indicators point towards a potential bullish trend, and it could be an opportune time for investors to watch this stock closely. As always, it’s crucial to do your own research and make investment decisions that align with your financial goals and risk tolerance. Stay tuned for more market updates as we continue to navigate through the financial market landscape.

Leave a comment