Preface
Being market enthusiasts, exploring speculative plays like the IWM Short Play is always intriguing. Yet, it’s vital to note that the weekly time frame remains bullish. This speculative trade hinges on a tight stop loss, ready to flip to bullish as the 4H time frame signals. We’ll keep updating this article as the situation unfolds.
Weekly Time Frame
In the weekly time frame, the clouds are still bullish. The oscillator indicates a squeeze, maintaining support on the oscillator line. This might signal a time to go long, something we’ll delve deeper into. The lower time frames could suggest a continuation downside or confirm the persistence of the weekly bullish time frame, implying a temporary pull back. The hourly and 4HR clouds will play a crucial role.
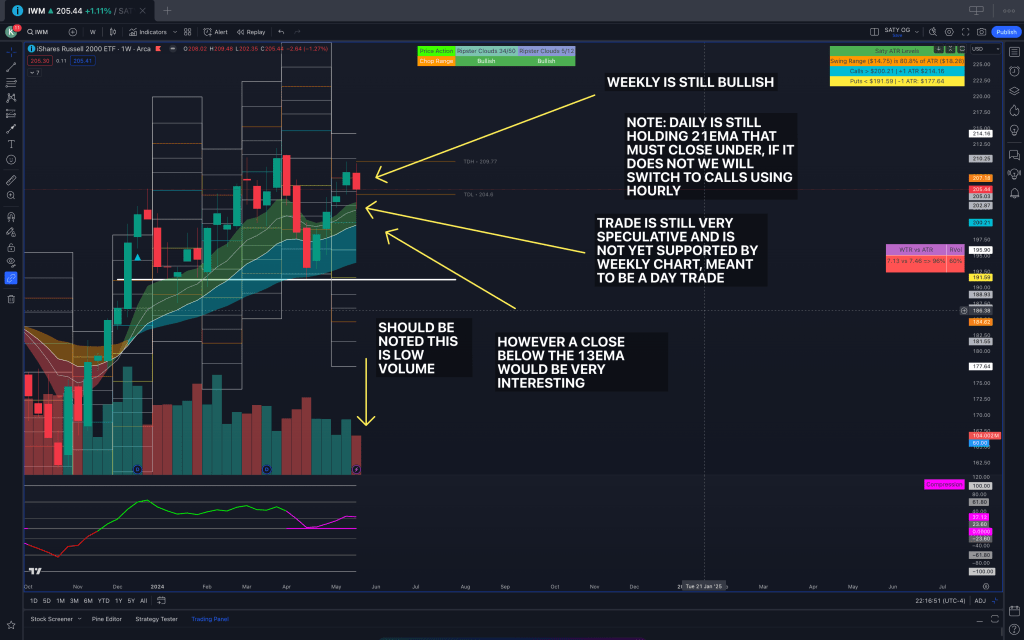
Daily Time Frame
The daily time frame offers some interesting insights too. Despite bullish clouds, price action has struggled to hit new highs. We recently tested the 48EMA on high volume and retook the 21EMA on lower volume. The 13EMA will be a vital pivot in the daily time frame, aligning with our 4HR and 1HR time frame pivots. It’s worth mentioning that the oscillator continues to hold its support.
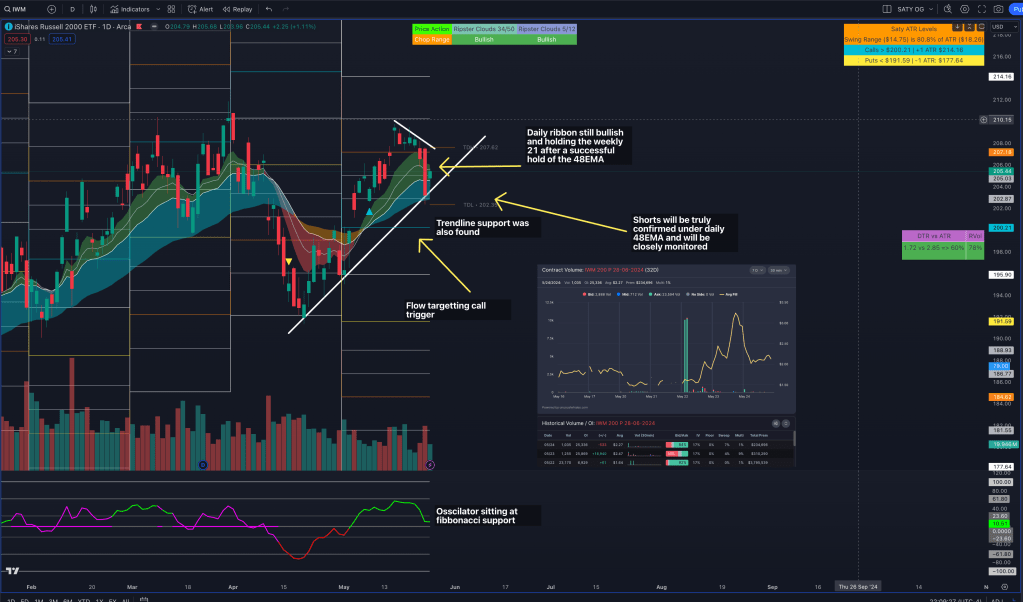
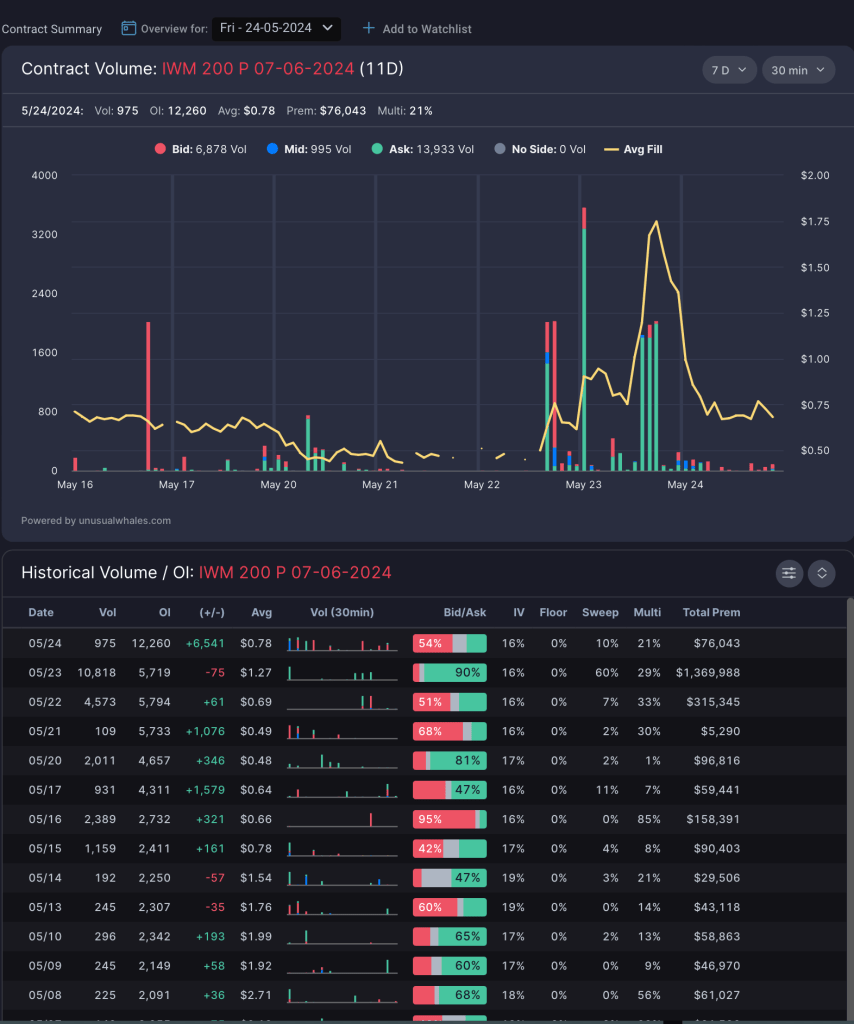
Interesting Options Flow
This is interesting flow that is visualized on the daily chart, however, we do not take trades purely based on flow, technicals and the system always come first, but this is good to monitor to see if this trader exits. This trader added $3M of IWM 200P June 28th, contributing to a significant OI increase, even after reaching 100% gains this trader did not take profit. The trade was only 4% multi leg indicating this was a purely 1 directional trade.

200P June 7th also got significant attention at the ask, and is showing that traders are holding the position despite a significant decrease of the premium.
Flow will continue to be monitored
4HR Time Frame KEY
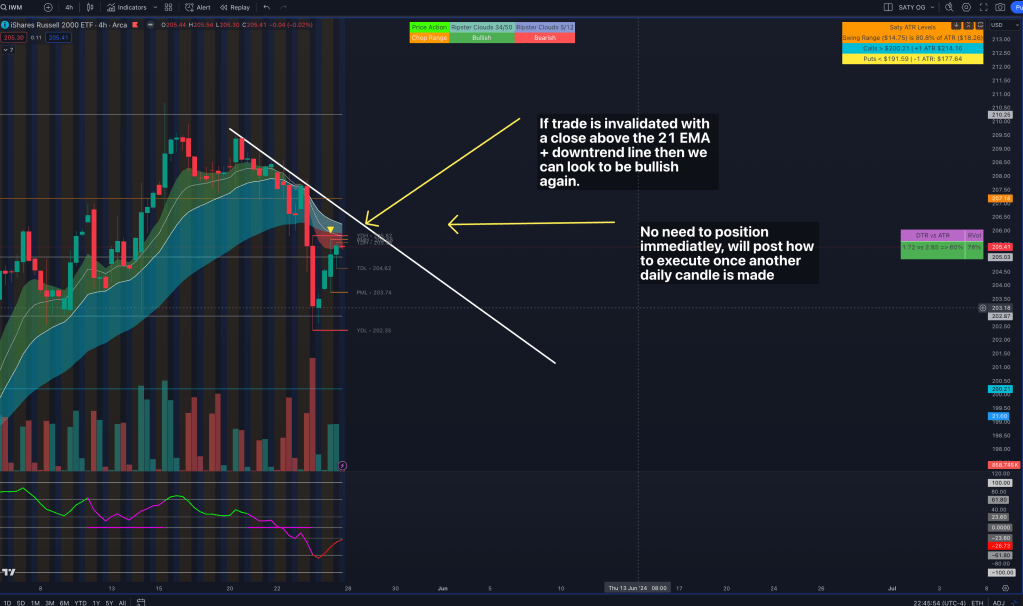
The 4HR time frame introduces an exciting twist, setting the stage for the reversal thesis. The short-term 5/12 clouds have fully shifted to bearish, allowing us to enter a short-term (possibly medium-term) short play with the 21EMA as our pivotal zone and risk level. The oscillator displays a clear downtrend, nearing the 0 line, which often acts as a pivot.
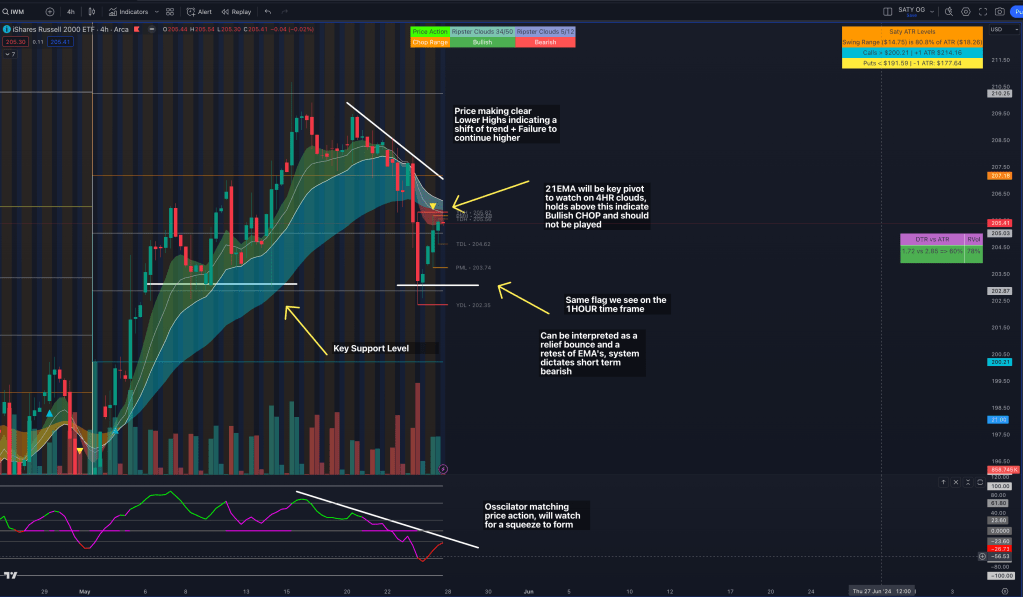
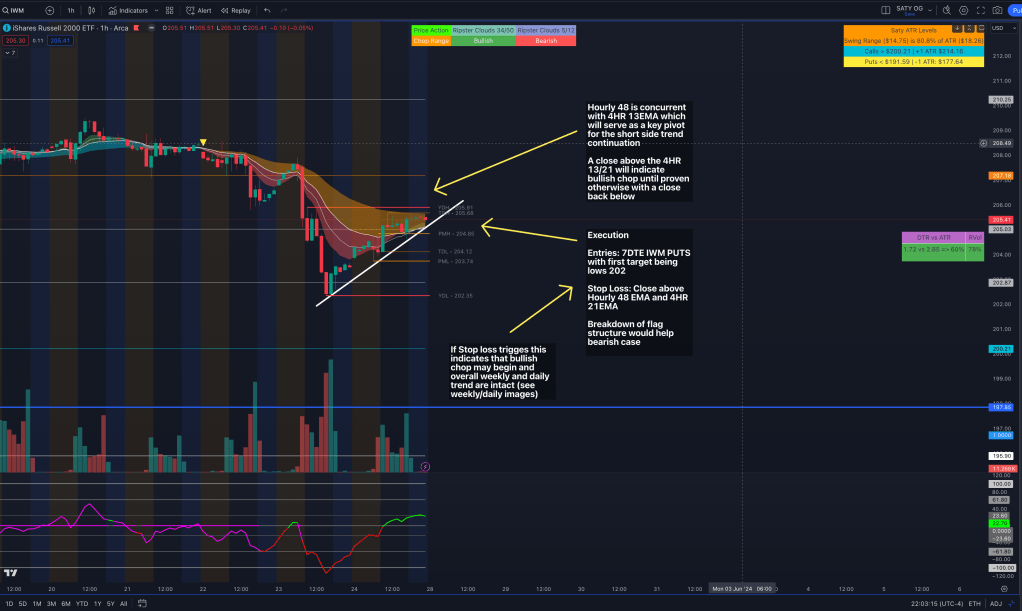
1HR Time Frame + Exeuction
We’ll execute our trade in the hourly time frame. The 48EMA hourly will serve as our pivot to enter and exit the position. Currently, the price is approaching the 48EMA, forming a bear flag. The trade will be invalidated with a close above the 48EMA, with entries for shorts against the 48EMA on Tuesday.
Trade Fails? Switch Bullish. Stay Tuned.
Switching to bullish will be a straightforward move. The system will guide us once we break back above the 4HR 21/48EMA and Downtrendline Pivot.
Keep an eye out for updates based on Tuesday’s market activity and mid-week guidance!

Leave a comment